Understanding Technical Analysis
Technical analysis is a method used to predict future price movement of a security by analyzing statistical trends gathered from trading activity,
Discover the power of technical analysis and learn how to make informed trading decisions.
Technical analysis is a method used to predict future price movement of a security by analyzing statistical trends gathered from trading activity,
Price charts are at the heart of trading. In addition to helping traders monitor the value of their current positions,

Candlesticks are created by up and down movements in the price. While these price movements sometimes appear random, at other times they form patterns that traders use for analysis or trading purposes

A bearish engulfing pattern occurs at the end of an uptrend.
Learn about chart patterns to enhance your understanding of market analysis and trading techniques.
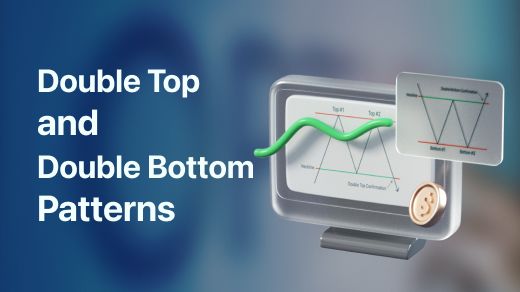
A double top is a bearish technical reversal pattern that forms after an asset reaches a high price two consecutive times with a moderate decline between the two highs.
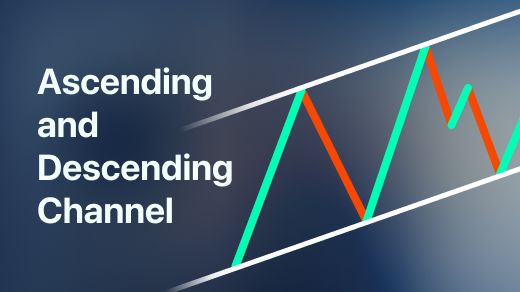
An ascending channel occurs when analyzing an overall uptrend in the asset price. It is a series of price highs and lows contained between upward-sloping parallel lines.
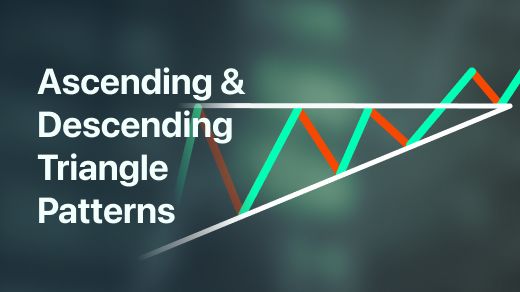
An ascending triangle is a bullish continuation pattern, and it is created by price moves that allow for a horizontal line to be drawn along the swing highs and a rising trendline to be drawn along th
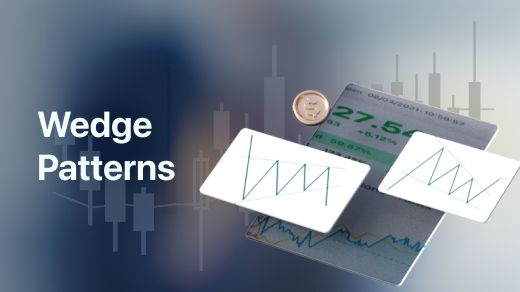
A wedge is a price pattern marked by converging trend lines on a price chart. The two trend lines are drawn to connect the respective highs and lows of a price series over the periods of time.
Technical indicators are an important tool for traders to predict market trends and identify the entry or exit price point. Check out this course to learn more tips on how to use techinical indicators.
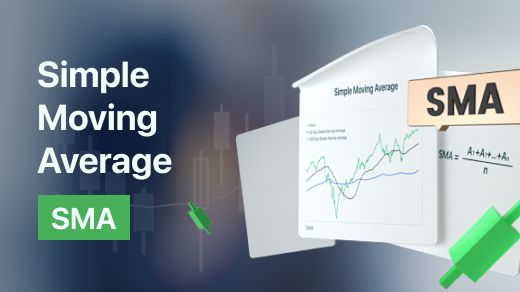
Simple Moving average (SMA) is a technical indicator for investors to use to determine the direction of a price trend.

The Exponential Moving Average (EMA) is a technical indicator used in trading practices that shows how the price of an asset or security changes over a certain period of time.
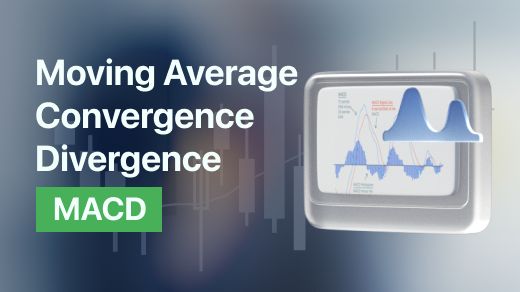
The MACD indicator is a momentum oscillator that measures the amount that an asset's price has changed over a given period of time.
The Relative Strength Index (RSI) is a momentum indicator used in technical analysis,