The Trend Catcher | Apple Surges +5.66%, Volume Explodes +288% — A 152% ROE Stock Just Flashed a Breakout Signal
Apple Inc. AAPL | 0.00 | |
Williams Companies, Inc. WMB | 0.00 | |
First American Financial Corporation FAF | 0.00 | |
Tanger Inc. SKT | 0.00 | |
Travelers Companies, Inc. TRV | 0.00 |
Subscribe to "The Trend Catcher Topic," tracking hottest sectors & technical breakouts in real time daily, accompanying you every US stock trading day.
The S&P 500 index(SPX.US)rose on Friday, boosted by Apple Inc.(AAPL.US) shares, while oil prices fell as a new month of trading got underway.
The broad market index gained 0.5%, while the NASDAQ(IXIC.US) Composite added 0.7%. The Dow Jones Industrial Average(DJI.US) advanced 112 points, or 0.2%.
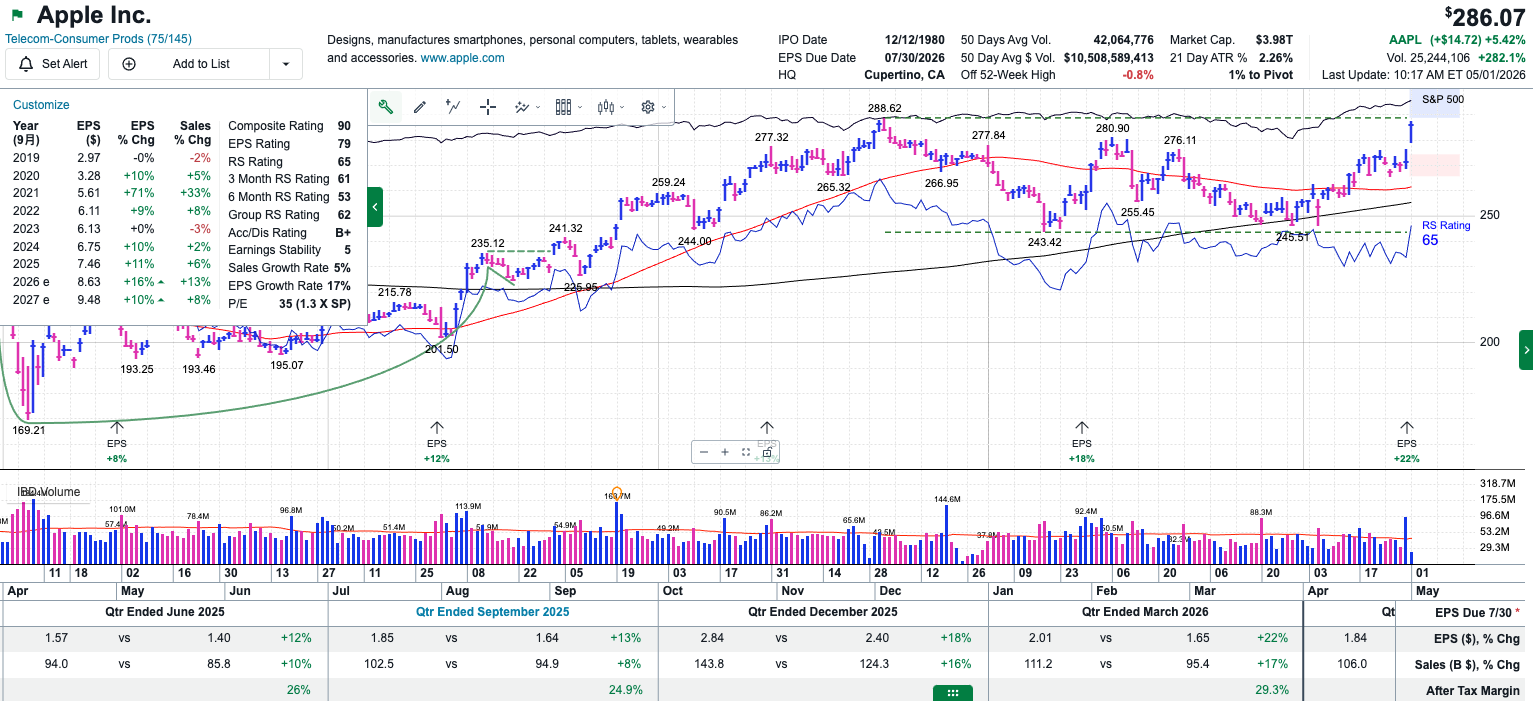
Shares of Apple climbed more than 4% after the consumer tech giant posted a fiscal second-quarter earnings and revenue beat. Not only that, the company’s revenue outlook for the current quarter was better than expected, overshadowing the fact that iPhone revenue fell short of estimates for the second time in three quarters.
1. Leader industry as of 5:11 pm
| Name | Price % Chg | Ind Group Rank | Ind Grp Rnk Last Week | Ind Grp Rnk 3 Mo Ago | Ind Grp Rnk 6 Mo Ago | Number of Stocks | % Chg YTD | Ind Mkt Val (bil) |
| Computer Sftwr-Medical | 7.63 | 141 | 140 | 141 | 0 | 24 | -29.1 | 43.9 |
| Internet-Network Sltns | 6.33 | 72 | 70 | 67 | 0 | 17 | 12.9 | 112.0 |
| Utilities | 4.85 | 53 | 57 | 75 | 0 | 88 | 13.3 | 2,149.8 |
| Computer Sftwr-Database | 4.65 | 115 | 88 | 142 | 0 | 17 | -14.8 | 525.6 |
| Telecom-Consumer Prods | 4.47 | 75 | 63 | 90 | 0 | 7 | -2.2 | 4,138.0 |
Sector Logic: Telecom-Consumer Prods
Growth Drivers: The convergence of AI infrastructure expansion and rising consumer device complexity is creating new demand vectors. Goldman Sachs highlights that surging memory costs are pressuring traditional smartphone and PC margins, while simultaneously driving the need for advanced components—such as Murata’s AI server MLCCs and next-generation power solutions—to support localized AI processing. Furthermore, companies are actively accelerating content value enhancements in next-gen form factors (like foldables) and expanding liquid-cooling and humanoid robot businesses to offset cyclical consumer headwinds.
Market Outlook: While traditional consumer electronics face near-term demand fatigue and macro-driven margin pressures, the sector is bifurcating. Component suppliers shifting toward high-value AI and automotive applications are seeing structural repricing. For instance, advanced MLCCs for AI servers are projected to double in sales annually over the next 2-3 years, and AI-driven power management products are preparing for significant revenue ramps. Conversely, pure-play consumer hardware remains constrained by elevated memory prices and inventory adjustments, though a sequential recovery is anticipated from 2Q26 onwards.
Recent Moves: Supply chain diversification and overseas capacity optimization are aggressively underway to mitigate geopolitical and currency risks. Meanwhile, AI capital expenditure upgrades from hyperscalers are validating robust order backlogs for infrastructure-adjacent components, effectively decoupling their growth trajectories from the sluggish replacement cycle of legacy consumer endpoints.
2. Breaking Out Today as of 5:11 pm
| Symbol | Comp Rating | Industry Name | Current Price | Price $ Chg | Price % Chg | Vol % Chg vs 50-Day | Market Cap (mil) | EPS Rating | RS Rating | A/D Rating | SMR Rating | Ind Group Rank |
| - | - | - | - | - | - | - | - | - | - | - | - | - |
3. Near Breakouts as of 5:11 pm
| Symbol | Name | Comp Rating | Industry Name | Current Price | Price % Chg | Volume (1000s) | Price $ Chg | EPS Rating | RS Rating | Vol % Chg vs 50-Day | Ind Group RS | SMR Rating | A/D Rating | Market Cap (mil) |
| Williams Companies, Inc.(WMB.US) | Williams Cos. | 97 | Oil&Gas-Integrated | 75.14 | -1.53 | 492 | -1.17 | 80 | 79 | -9.0 | A | A | B | 93,316.2 |
| First American Financial Corporation(FAF.US) | First American Financial Corp. | 96 | Insurance | 69.44 | -0.98 | 39 | -0.69 | 98 | 68 | -28.5 | B | B | A+ | 7,146.2 |
| Tanger Inc.(SKT.US) | Tanger Inc. | 96 | REITs | 36.73 | -0.96 | 139 | -0.35 | 78 | 70 | 170.4 | B+ | A | A | 4,246.9 |
| Travelers Companies, Inc.(TRV.US) | Travelers Cos. Inc. | 95 | Insurance | 308.18 | 1.00 | 60 | 3.04 | 99 | 66 | -55.9 | B | A | B+ | 64,886.4 |
| Primerica, Inc.(PRI.US) | Primerica Inc. | 94 | Insurance | 280.12 | -0.41 | 45 | -1.16 | 92 | 60 | 473.8 | B | A | A+ | 8,831.1 |
| ZTO Express (Cayman) Inc. Sponsored ADR Class A(ZTO.US) | ZTO Express (Cayman) Inc. ADR | 93 | Transportation-Logistics | 25.38 | -0.82 | 81 | -0.21 | 82 | 82 | -68.6 | A- | A | C | 18,784.2 |
| Apple Inc.(AAPL.US) | Apple Inc. | 90 | Telecom-Consumer Prods | 286.71 | 5.66 | 23,634 | 15.37 | 79 | 65 | 288.7 | B- | A | B+ | 3,983,727.3 |
| Canadian Pacific Kansas City Limited(CP.US) | Canadian Pacific Kansas City Ltd. | 90 | Transportation-Rail | 87.02 | 0.07 | 212 | 0.06 | 60 | 72 | -12.7 | A- | B | A | 77,922.8 |
| GALDERMA GROUP AG(GALDY.US) | Galderma Group AG ADR | 90 | Medical - Pharmaceuticals | 42.10 | 0.39 | 1 | 0.16 | 79 | 79 | -87.9 | D+ | B | B | 49,183.7 |
| HSBC Holdings PLC Sponsored ADR(HSBC.US) | HSBC Holdings PLC ADR | 88 | Banks-Money Center | 92.70 | 0.92 | 304 | 0.84 | 93 | 78 | -20.3 | B | B | D- | 314,989.9 |
| Rio Tinto plc Sponsored ADR(RIO.US) | Rio Tinto PLC ADR | 83 | Mining-Metal Ores | 100.85 | 0.37 | 327 | 0.37 | 48 | 82 | -38.7 | B+ | A | D+ | 169,995.0 |
| Walmart Inc.(WMT.US) | Walmart Inc. | 82 | Retail - General | 132.87 | 0.71 | 1,458 | 0.94 | 51 | 79 | -45.8 | B | B | C+ | 1,051,799.0 |
Subscribe to The Trend Catcher Topic / The Value Anchor Topic —unlock the full historical archive and never miss a weekly pick again.
Related Stocks Chart
| Company Fundamentals | |
|---|---|
| EPS Due Date | 7/30/2026 |
| EPS % Chg (Last Qtr) | 22% |
| 3 Year EPS Growth Rate | 0% |
| EPS Est % Chg (Current Yr) | 16% |
| Annual ROE | 152% |
| Sales % Chg (Last Qtr) | 17% |
| 3-Year Sales Growth Rate | 5% |
| Debt % | 122% |
| Market Cap | $3984 Bil |
| Annual Pre -Tax Margin | 35.48% |
| Sector | Telecom |
| Industry Group | Telecom-Consumer Prods |
| Industry Group Rank | 75 |
More of Our Investment Philosophy>>
Disclaimer: The content is provided as general information only and should not be taken as investment advice. All the contents shall not be taken as a recommendation to buy or sell any security or financial instruments. Any action you take resulting from information, analysis, or commentary on this article is your responsibility. Please consult your investment advisor before making any investments.