
We Value Your Feedback! Help us shape better content and experiences by participating in our survey. Join the Survey Now!
Saudi Market
TASI Technical Analysis:
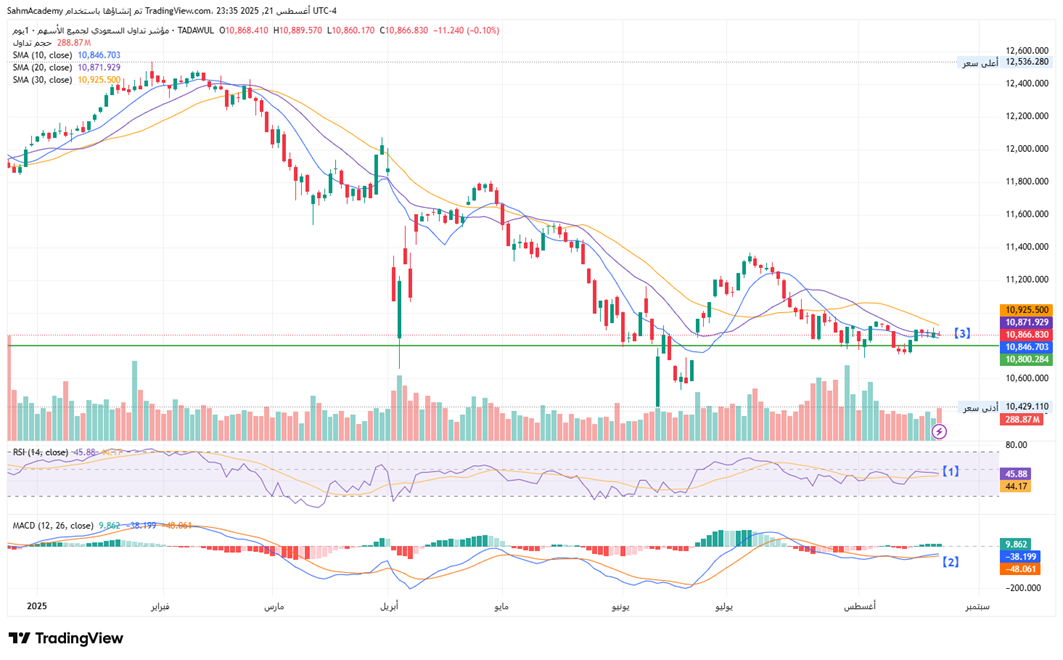
The TASI index is currently exhibiting signs of stabilization around current levels near 10,866. The price action has formed a descending channel pattern throughout the decline, recent sessions show the index consolidating around key moving averages with the current price (10,866) positioned between the SMA 10 (10,846) and SMA 20 (10,871), suggesting a potential inflection point.
[1] RSI has recovered to 45.88 from oversold conditions, indicating some momentum relief.
[2] MACD remains negative at -38.199 but shows signs of convergence.
[3] The index is testing critical support around the 10,800 zone, with volume patterns suggesting institutional interest at these lower levels.
From a trading perspective, the current setup presents a neutral-to-cautiously optimistic outlook as the index appears to be forming a potential base around the 10,800 support level. The convergence of moving averages and the RSI's departure from oversold territory suggest the selling pressure may be exhausting. A sustained break above 10,950 with volume confirmation would signal a potential trend reversal, while a breakdown below 10,800 could target the previous low around 10,429. Given the current technical setup, maintaining a cautiously optimistic stance is warranted, with particular attention to volume confirmation on any upward moves as the index attempts to establish a sustainable bottom.
TASI Index Weekly Market Summary (August 17 to August 21)
The TASI index decreased by 0.28%. With a trading week of 5 days, the total trading volume reached 20 billion Saudi Riyals, averaging 4.1 billion per day.
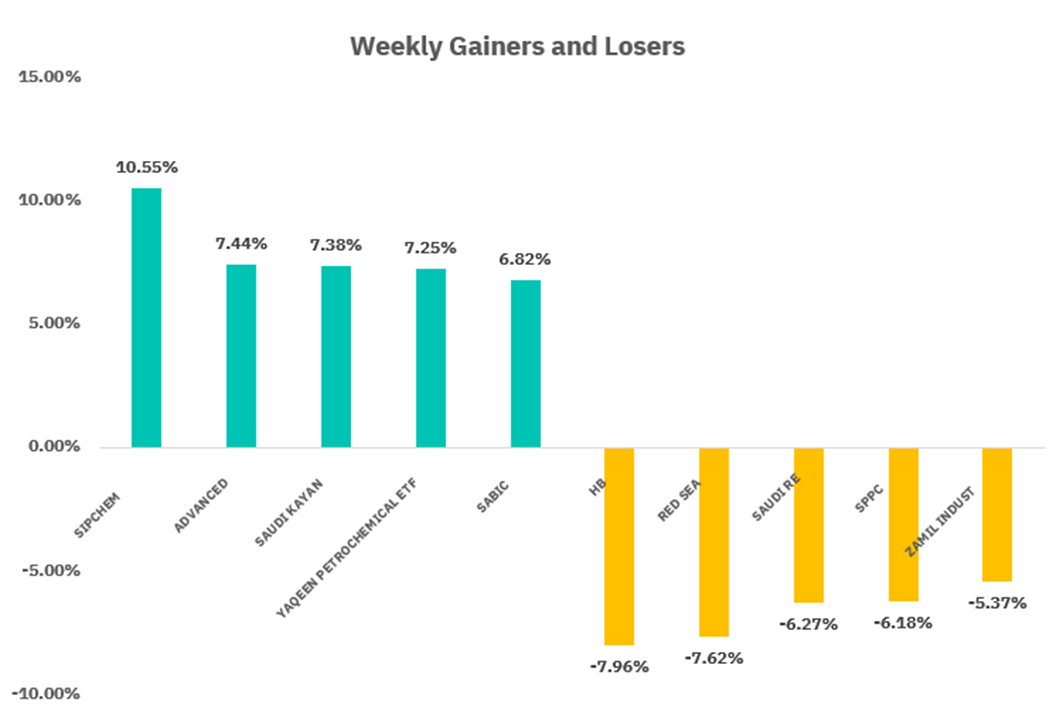
From the perspective of individual stock performance, 81 companies saw their stock prices rise this week, while 186 companies saw their stock prices fall. The companies with the highest increase included SIPCHEM, ADVANCED, SAUDI KAYAN, with increases of 10.55%, 7.44%, and 7.38% respectively. The companies with the highest decline included HB, RED SEA, SAUDI RE with declines of 7.96%, 7.62 %, and 6.27% respectively.
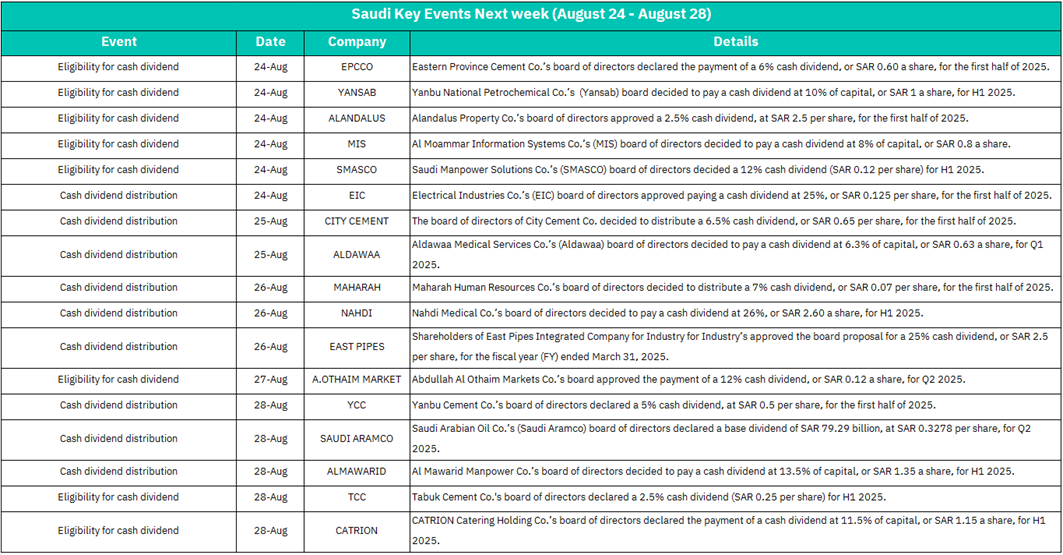
August 24 :
EPCCO - Cash dividend eligibility (6% dividend, SAR 0.60/share for H1 2025)
YANSAB - Cash dividend eligibility (10% of capital, SAR 1/share for H1 2025)
ALANDALUS - Cash dividend eligibility (2.5% dividend, SAR 2.5/share for H1 2025)
MIS - Cash dividend eligibility (8% of capital, SAR 0.8/share)
SMASCO - Cash dividend eligibility (12% dividend, SAR 0.12/share for H1 2025)
EIC - Cash dividend distribution (25% dividend, SAR 0.125/share for H1 2025)
Market Impact: HIGH POSITIVE - Strong opening with multiple high-yield dividends. YANSAB's 10% petrochemical dividend and EIC's 25% electrical industries distribution signal sector strength. ALANDALUS property dividend maintains real estate sector appeal.
August 25:
CITY CEMENT - Cash dividend distribution (6.5% dividend, SAR 0.65/share for H1 2025)
ALDAWAA - Cash dividend distribution (6.3% of capital, SAR 0.63/share for Q1 2025)
Market Impact: MODERATE - Building materials (CITY CEMENT) and pharmaceutical sectors (ALDAWAA) showing consistent dividend policies, supporting sector stability.
August 26:
MAHARAH - Cash dividend distribution (7% dividend, SAR 0.07/share for H1 2025)
NAHDI - Cash dividend distribution (26% dividend, SAR 2.60/share for H1 2025)
EAST PIPES - Cash dividend distribution (25% dividend, SAR 2.5/share for fiscal year ended March 31, 2025)
Market Impact: VERY HIGH SIGNIFICANCE - NAHDI's exceptional 26% healthcare dividend (SAR 2.60/share) and EAST PIPES' 25% industrial dividend (SAR 2.5/share) represent two of the highest yields in the market. This positions Monday as a major liquidity injection day.
August 27:
AJOTHAIM MARKET - Cash dividend eligibility (12% dividend, SAR 0.12/share for Q2 2025)
Market Impact: MODERATE - Retail sector (AJOTHAIM MARKET) maintaining steady dividend policy, though relatively modest compared to other sectors this week.
August 28
YCC - Cash dividend distribution (5% dividend, SAR 0.5/share for H1 2025)
SAUDI ARAMCO - Cash dividend distribution (Base dividend SAR 79.29 billion, SAR 0.3278/share for Q2 2025)
ALMAWARID - Cash dividend distribution (13.5% of capital, SAR 1.35/share for H1 2025)
TCC - Cash dividend eligibility (2.5% dividend, SAR 0.25/share for H1 2025)
CATRION - Cash dividend eligibility (11.5% of capital, SAR 1.15/share for H1 2025)
Market Impact: MAXIMUM SIGNIFICANCE - SAUDI ARAMCO's massive SAR 79.29 billion dividend distribution dominates the day, providing enormous market liquidity. ALMAWARID's 13.5% manpower sector dividend and CATRION's 11.5% catering dividend add substantial sector-specific momentum.
U.S. Market
S&P500 Technical Analysis:
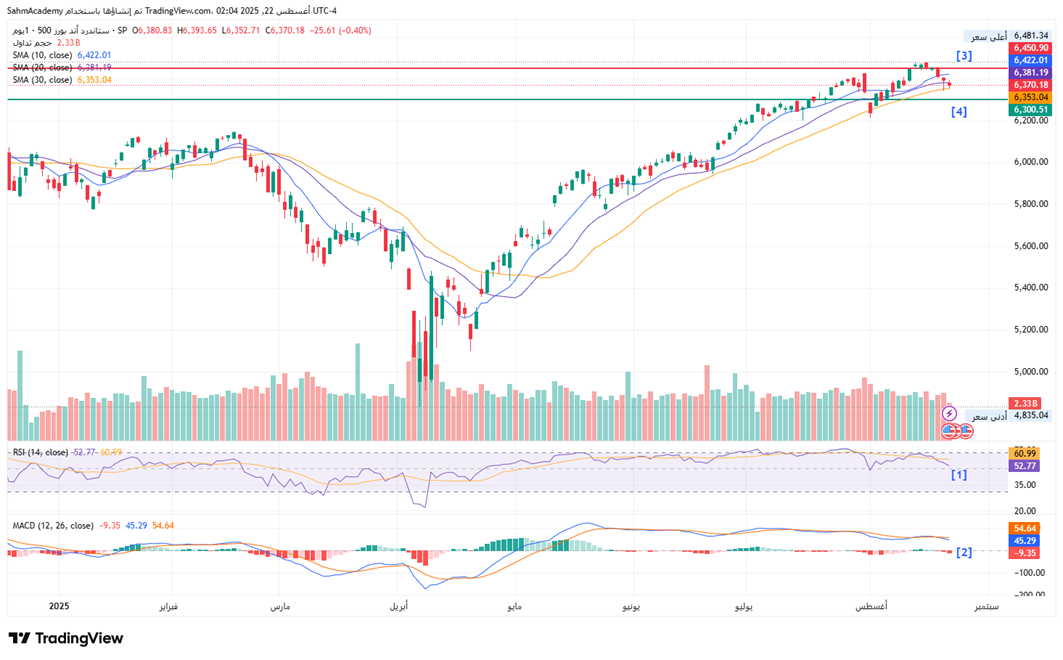
The S&P 500 is displaying classic late-stage bull market characteristics, having staged an impressive recovery from the March lows to current levels near 6,370, representing a gain of approximately 32% over six months. The moving average structure remains bullish with the index trading above all key moving averages (SMA 10: 6,422, SMA 20: 6,381, SMA 30: 6,353), showing strong momentum continuation.
[1] RSI at 52.77 has retreated from overbought levels and is showing signs of negative divergence.
[2] MACD at -9.35 has rolled over despite the index maintaining near highs, suggesting underlying momentum is weakening.
[3] From a strategic perspective, the S&P 500 appears to be entering a consolidation phase after the substantial rally, with the index testing around 6,450 resistance zone.
[4] Key support levels to monitor are 6,300. The recent pullback of -0.40% on modest volume suggests profit-taking rather than fundamental deterioration, but the negative divergences in momentum indicators warrant caution. A break above 6,450 with strong volume would target new all-time highs toward 6,600, while a breakdown below 6,300 could initiate a deeper correction toward the 6,000-6,100 support zone.
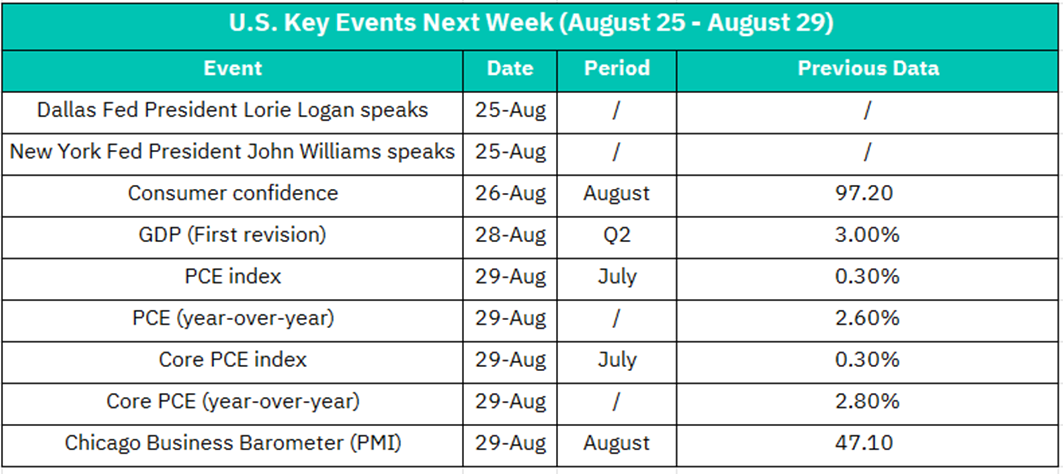
August 25:
• Dallas Fed President Lorie Logan speaks
• New York Fed President John Williams speaks
Market Impact: MODERATE TO HIGH SIGNIFICANCE
Dual Fed commentary provides policy direction insights following recent FOMC minutes
Regional Fed perspectives often offer nuanced views on economic conditions
Key focus areas:
- Rate path forward guidance
- Regional economic assessments
- Inflation progress evaluation
- Labor market commentary
August 26:
Consumer Confidence Index - August data
Previous: 97.20
Market Impact: HIGH SIGNIFICANCE
• Consumer spending represents ~70% of U.S. GDP
• Previous 97.20 indicates solid consumer sentiment
• Key threshold: Readings above 100 suggest optimism, below 90 indicate concern
Sector Implications:
• Consumer Discretionary: Directly correlated with confidence levels
• Retail stocks: Amazon (AMZN), Target (TGT), Home Depot (HD)
• Automotive: Consumer durables purchasing intentions
• Financial Services: Credit demand and spending patterns
August 28:
GDP (First Revision) - Q2 2025 data
Previous (Advance): 3.00%
Market Impact: VERY HIGH SIGNIFICANCE
• Most important economic indicator for overall market direction
• First revision typically provides more accurate economic growth picture
• Previous 3.00% suggests robust economic expansion
Critical Analysis:
• Above 3.5%: Signals strong growth, potential Fed hawkishness
• 2.5-3.0%: Confirms solid expansion, supports current policy
• Below 2.0%: Growth concerns, dovish Fed implications
August 29:
• PCE Price Index - July data
Previous: 0.30% MoM
Previous YoY: 2.60%
• Core PCE Price Index - July data
Previous: 0.30% MoM
Previous YoY: 2.80%
• Chicago Business Barometer (PMI) - August data
Previous: 47.10
Market Impact: MAXIMUM SIGNIFICANCE
• Fed's preferred inflation measure (PCE) takes center stage
• Triple data release providing comprehensive economic assessment
PCE Analysis:
• Core PCE at 2.80% YoY above Fed's 2% target
• Critical for Fed policy: Any acceleration reduces rate cut probability
• Monthly reading: 0.30% suggests persistent price pressures
Chicago PMI Analysis:
• Previous 47.10 indicates manufacturing contraction
• Regional manufacturing barometer for industrial sector
• Below 50: Continued weakness, Above 50: Expansion return
Crypto ETF Technical Analysis:
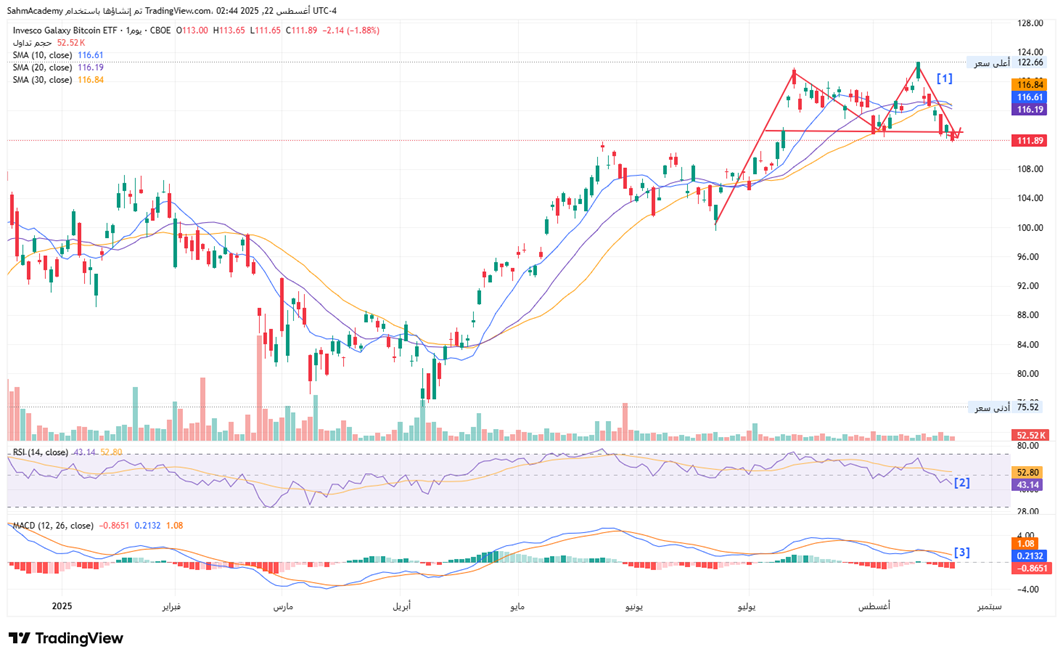
The BTCO Bitcoin ETF is currently experiencing a significant technical breakdown after reaching new highs around 122.66 in July, having since declined approximately 9% to current levels near 111.89. The ETF has broken below all major moving averages (SMA 10: 116.61, SMA 20: 116.19, SMA 30: 116.84), with the moving averages now in bearish alignment, signaling a potential trend reversal from the strong uptrend that dominated the first half of 2025.
[1] The price action shows a clear double-top formation at the July highs, followed by a decisive break below the neckline support around 113, which represents a classic bearish reversal pattern.
[2] Technical indicators are confirming the deteriorating momentum: RSI has declined to 43.14 from overbought levels.
[3] MACD at -0.8651 has turned negative with the signal line crossing below zero, indicating accelerating bearish momentum.
From a trading perspective, BTCO appears to be entering a deeper corrective phase with immediate support at 110. The breakdown from the double-top pattern suggests a measured target toward 100-102 based on the height of the pattern, representing approximately 18-20% decline from recent highs. The current volume patterns show increased selling pressure on down moves, confirming institutional distribution. Given the clear technical breakdown, negative momentum divergences, and breach of key support levels, maintaining a bearish stance is warranted with potential for further downside toward the 100-105 target zone, while any rallies toward 115-118 should be viewed as selling opportunities rather than sustainable reversals.
Disclaimer:
Sahm is subject to the supervision and control of the CMA, pursuant to its license no. 22251-25 issued by CMA.
The Information presented above is for information purposes only, which shall not be intended as and does not constitute an offer to sell or solicitation for an offer to buy any securities or financial instrument or any advice or recommendation with respect to such securities or other financial instruments or investments. When making a decision about your investments, you should seek the advice of a professional financial adviser and carefully consider whether such investments are suitable for you in light of your own experience, financial position and investment objectives. The firm and its analysts do not have any material interests or conflicts of interest in any companies mentioned in this report.
Performance data provided is accurate and sourced from reliable platforms, including Argaam, TradingView, MarketWatch.
IN NO EVENT SHALL SAHM CAPITAL FINANCIAL COMPANY BE LIABLE FOR ANY DAMAGES, LOSSES OR LIABILITIES INCLUDING WITHOUT LIMITATION, DIRECT OR INDIRECT, SPECIAL, INCIDENTAL, CONSEQUENTIAL DAMAGES, LOSSES OR LIABILITIES, IN CONNECTION WITH YOUR RELIANCE ON OR USE OR INABILITY TO USE THE INFORMATION PRESENTED ABOVE, EVEN IF YOU ADVISE US OF THE POSSIBILITY OF SUCH DAMAGES, LOSSES OR EXPENSES.
