
We Value Your Feedback! Help us shape better content and experiences by participating in our survey. Join the Survey Now!
Saudi Market
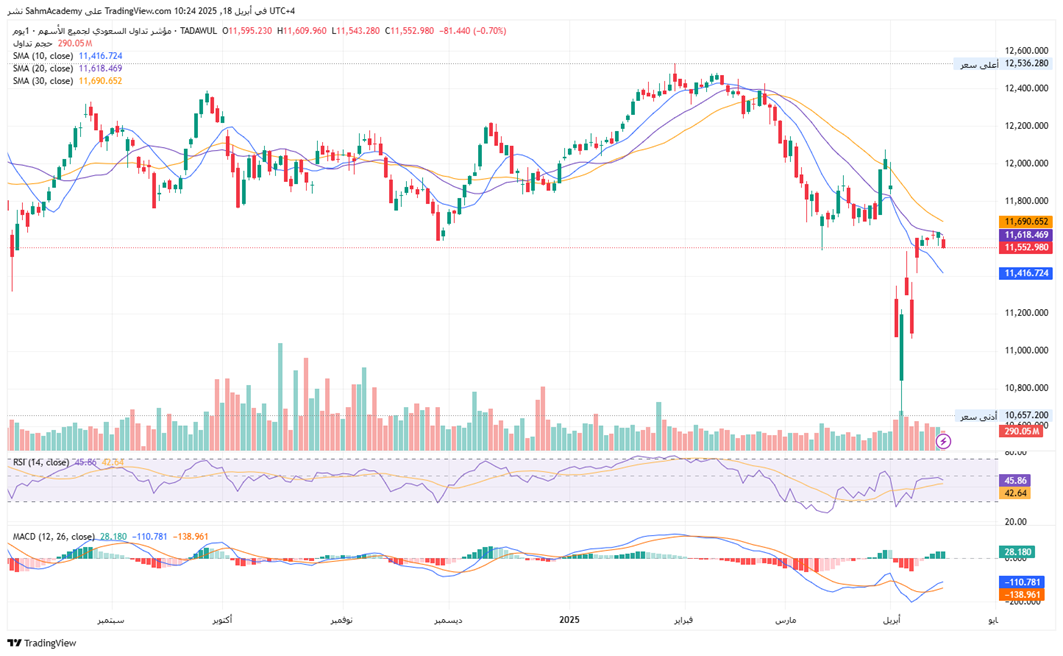
TASI Technical Analysis:
The Saudi TASI Index is currently trading at 11,552.98, down 81.44 points (-0.70%). In the short term, TASI is trading above the 10-day SMA (11,416.72), suggesting potential short-term stabilization, while remaining below the 20-day (11,618.47) and 30-day SMAs (11,690.65), confirming the bearish intermediate trend. All three moving averages are sloping downward, and the widening gap between them indicates accelerating downside momentum. The RSI is at 45.86, in neutral territory but showing potential bottoming signs, with the secondary RSI at 42.64 reinforcing the neutral-bearish bias. The MACD presents a complex picture: while the MACD line (28.18) is above the signal line (-110.78), suggesting a potential bullish crossover, the MACD histogram (-138.96) remains negative despite some improvement, indicating lingering bearish pressure. Current volume stands at 290.05M, which is relatively elevated compared to recent averages, with a significant spike during the April selloff indicative of panic selling and potential capitulation. Recent modest volume accompanying green candles suggests cautious buying. Key resistance levels are at approximately 11,600 (aligning with the 20-day SMA) and the major 11,800-12,000 zone (previous support turned resistance), while supports are at the 11,400 area (recent consolidation) and the major 10,800-10,650 zone (recent lows level).
TASI Index Weekly Market Summary (April 13 to April 17)
The TASI index declined by 0.34%. With a trading week of 5 days, the total trading volume reached 28billion Saudi Riyals, averaging 5.6 billion per day.
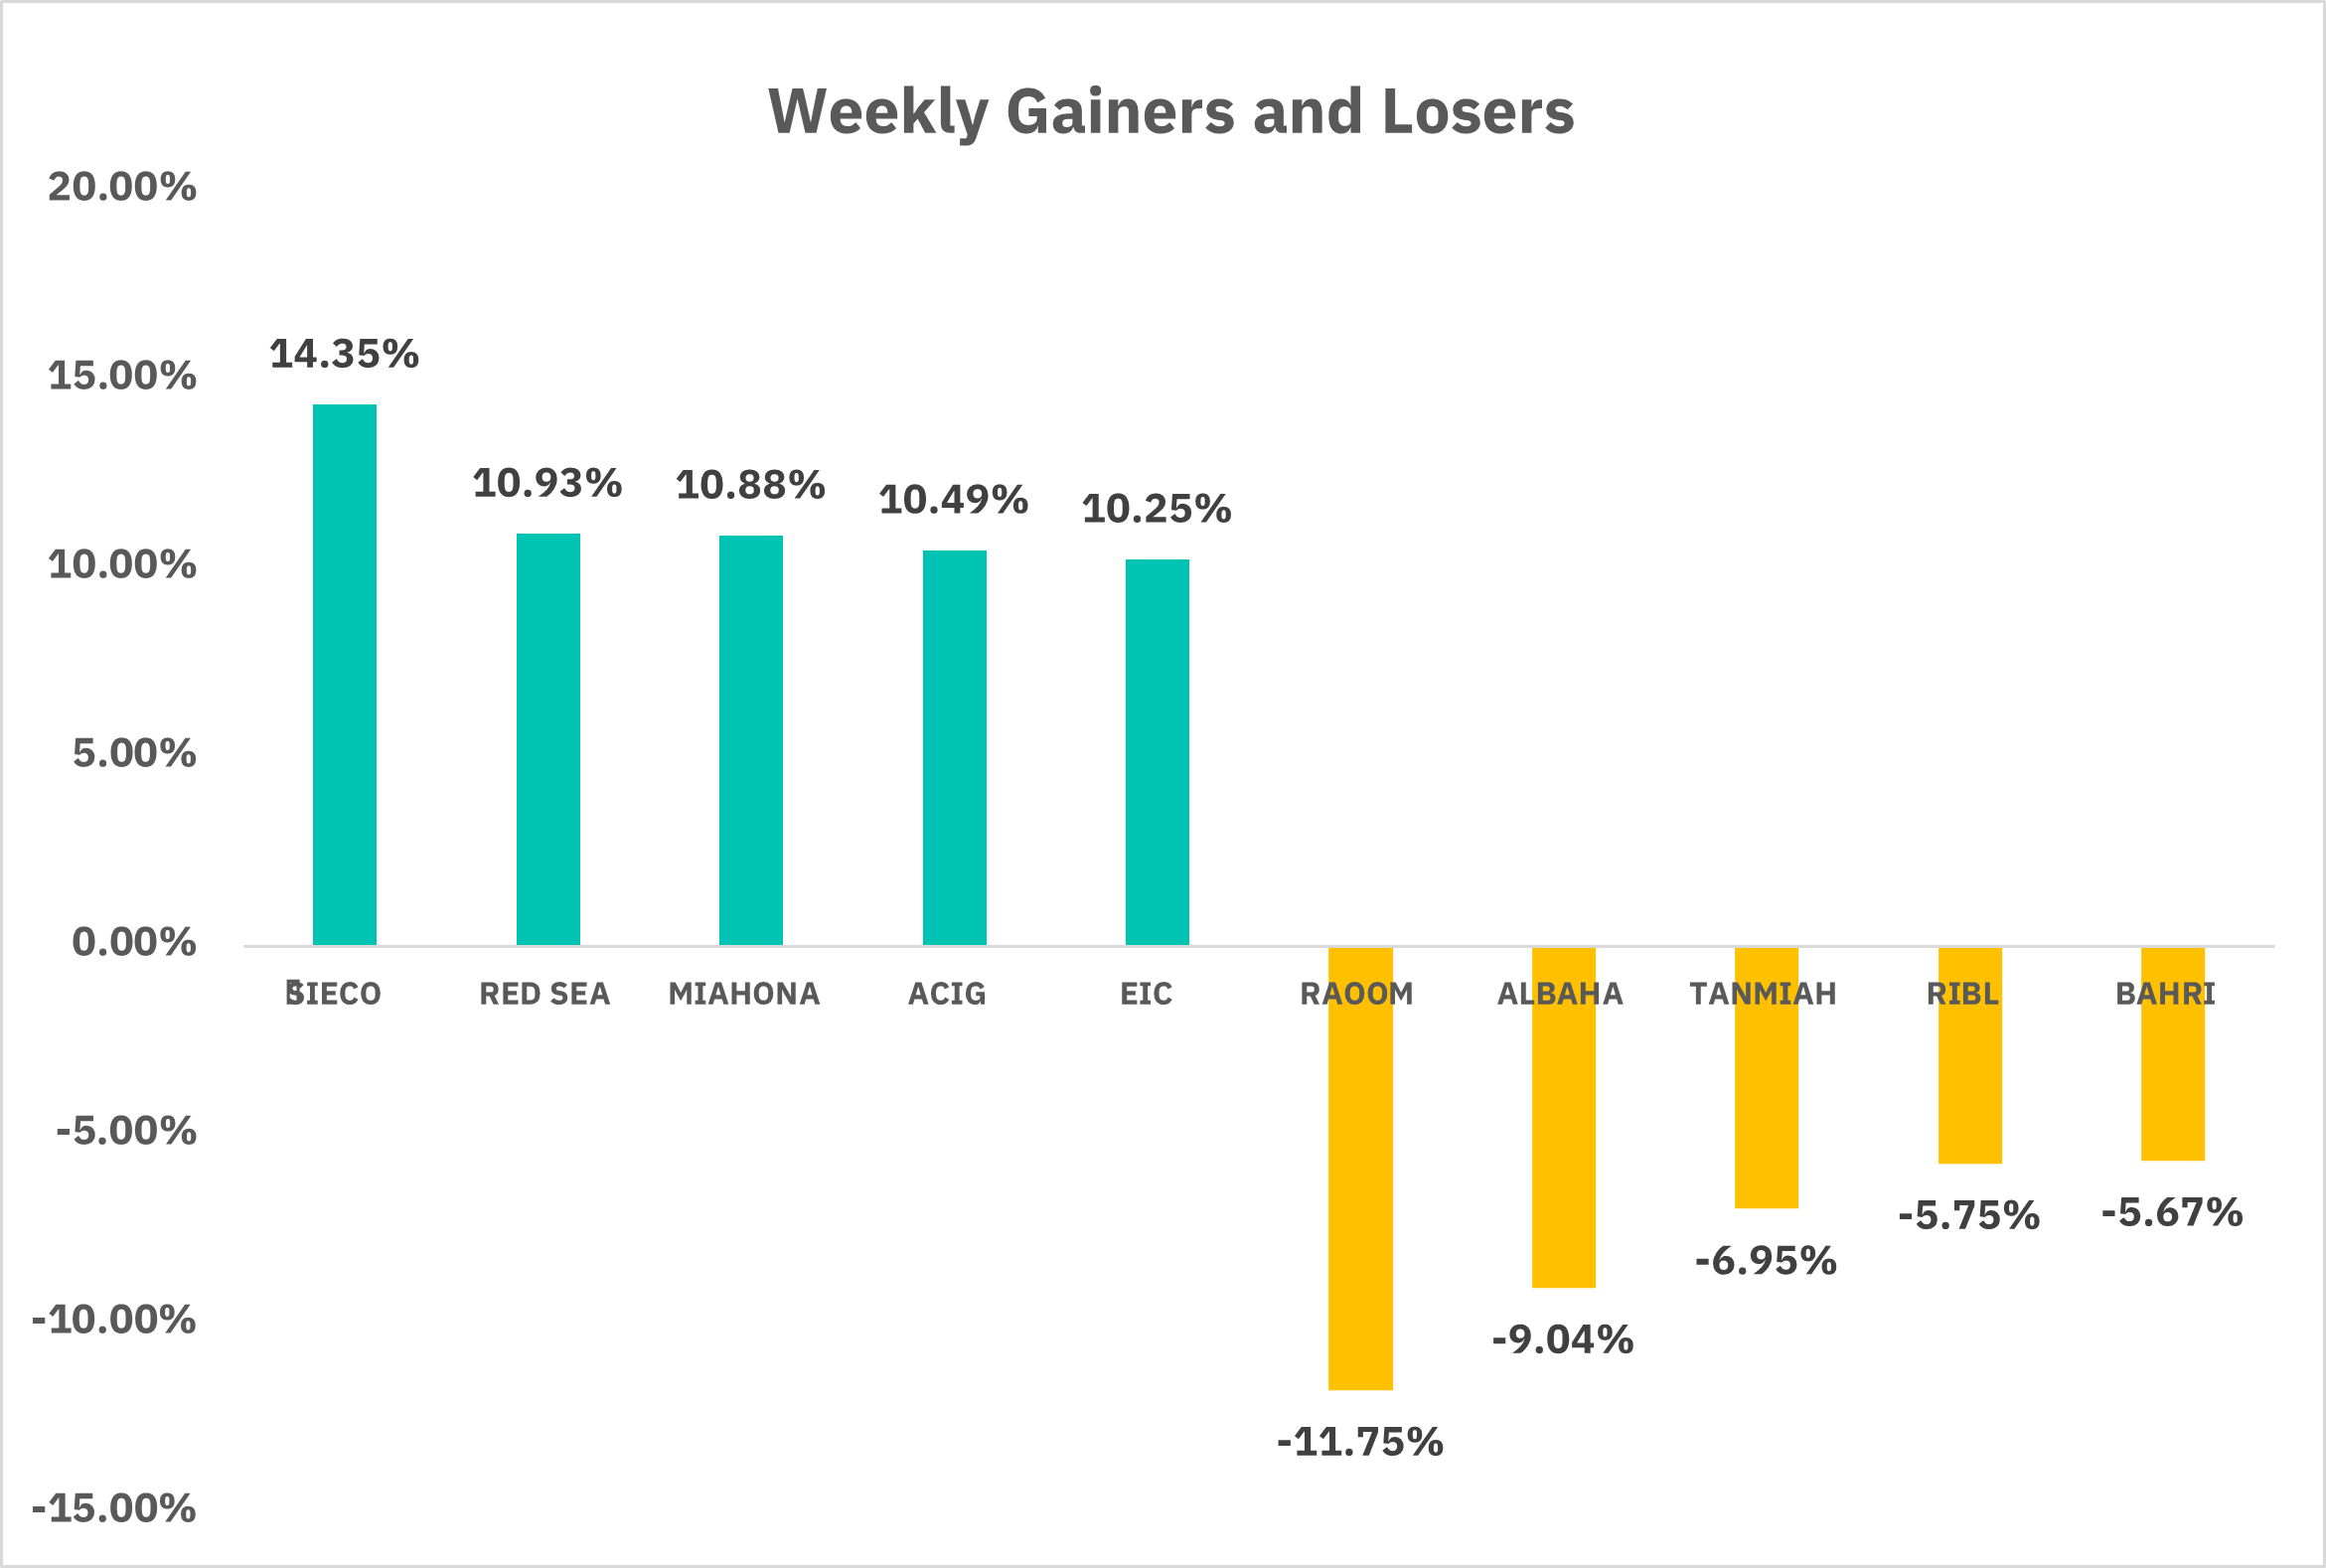
From the perspective of individual stock performance, 135 companies saw their stock prices rise this week, while 124 companies saw their stock prices fall. The companies with the highest increase included SIECO, RED SEA, MIAHONA, with increases of 14.35%, 10.93%, and 10.88% respectively. The companies with the highest decline included RAOOM, ALBAHA, TANMIAH, with declines of 11.75%, 9.04%, and 6.95% respectively.
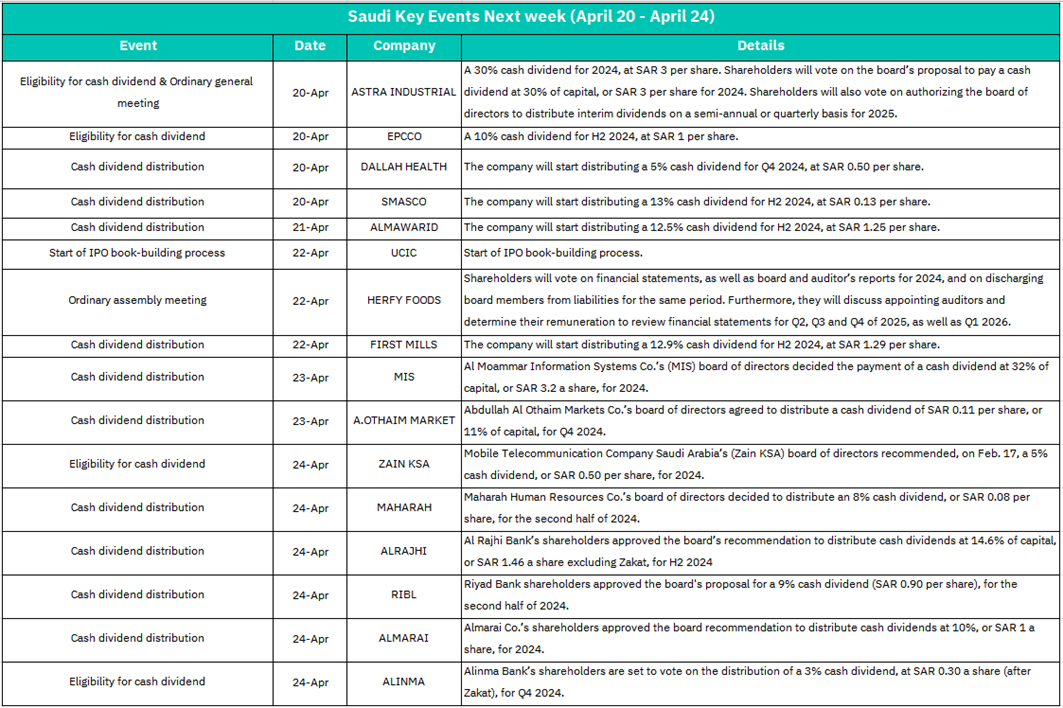
1.April 20– ASTRA INDUSTRIAL
Eligibility for 30% cash dividend (SAR 3/share) for 2024 and OGM to approve interim dividends for 2025. High dividend payout may attract income-focused investors, potentially boosting short-term demand for shares. Approval of interim dividends could signal sustained shareholder returns, improving investor confidence.
– EPCOO, DALLAH HEALTH, SMASCO
Dividend eligibility/distribution (10%, 5%, and 13% respectively). SMASCO’s higher dividend (13%) might drive short-term buying interest. Moderate payouts from EPCOO and DALLAH HEALTH may stabilize their stock prices but are unlikely to trigger significant volatility.
2. April 21 – ALMAWARID
Distribution of 12.5% cash dividend (SAR 1.25/share).
A competitive dividend yield could enhance stock liquidity and support price stability.
3. April 22 –UCIC
Start of IPO book-building.
Increased market attention on the IPO sector. Successful pricing may boost sentiment, but oversubscription risks could divert liquidity from existing stocks temporarily.
– HERFY FOODS
Shareholder vote on financial statements, board liability discharge, and auditor appointments.
Approval of financials and governance proposals would reinforce investor trust. Any dissent might raise concerns about governance, leading to short-term price pressure.
– FIRST MILLS
Distribution of 12.9% dividend (SAR 1.29/share).
High dividend payout aligns with Saudi market preferences for yield, likely supporting positive momentum.
4. April 23 – MIS, A.OTHAIM MARKET
MIS: 32% cash dividend (SAR 3.2/share) for 2024.
One of the highest payouts listed; likely to attract significant investor interest, driving short-term price appreciation.
A.OTHAIM MARKET: 11% dividend (SAR 0.11/share) for Q4 2024.
Modest payout may have limited impact, but consistent dividends could appeal to long-term holders.
5. April 24 – ZAIN KSA, MAHARAH, ALRAJHI, RIBL, ALMARAI, ALINMA
Dividend distributions/eligibility ranging from 3% (ALINMA) to 14.6% (ALRAJHI). ALRAJHI (14.6% dividend) and RIBL (9%) may see bullish sentiment due to above-average yields. ALINMA’s low 3% payout (post-Zakat) risks disappointing investors, possibly leading to minor sell-offs. ALMARAI (10%) and ZAIN KSA (5%) will likely maintain steady trading patterns.
U.S. Market
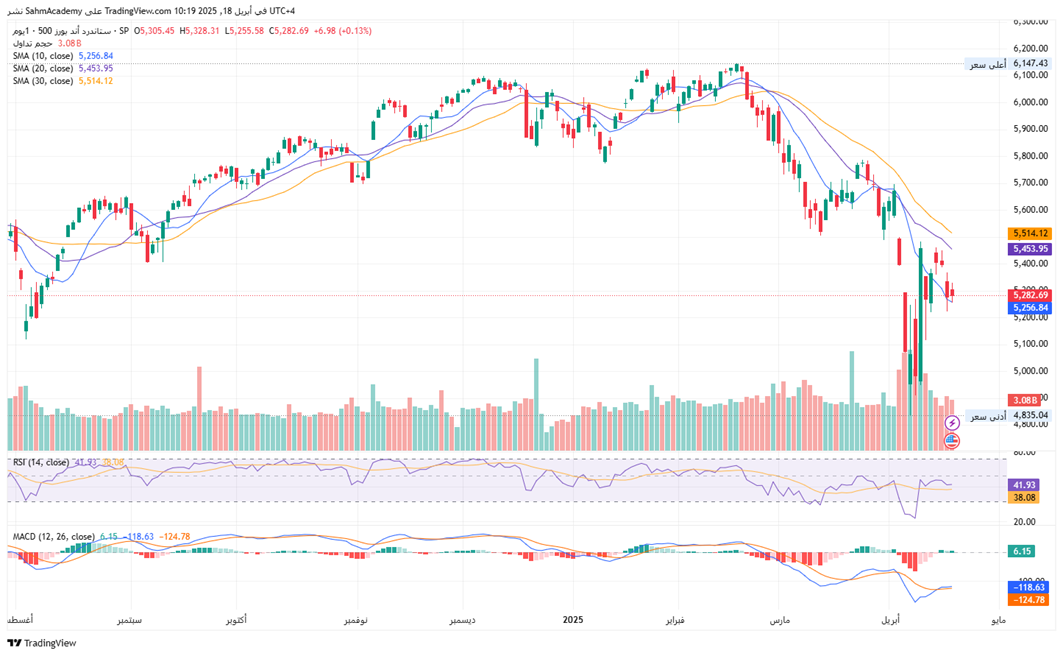
S&P500 Technical Analysis:
The S&P 500 is currently trading at 5,282.69, reveals a clear downtrend since February 2025, marked by lower highs and lows and significant selling pressure. The price is challenging the 5,250 support level and is only slightly above the 10-day SMA (5,256.84), while remaining below the 20-day (5,453.95) and 30-day SMAs (5,514.12), all of which are sloping downward. A death cross has formed, reinforcing the bearish trend. The RSI is at 41.93, nearing but not yet in oversold territory, with the secondary RSI at 38.08 indicating more weakness. The MACD shows mixed signals with the line above the signal line but both deeply negative, and a negative histogram, suggesting persistent bearish momentum. Current volume of 3.08B reflects increased participation during the decline, with spikes during the April sell-off indicating distribution and weak buying conviction during rallies. Key resistance levels are at 5,350 and the 5,450-5,500 zone, while supports are at 5,250 and the critical 5,100-5,000 area.
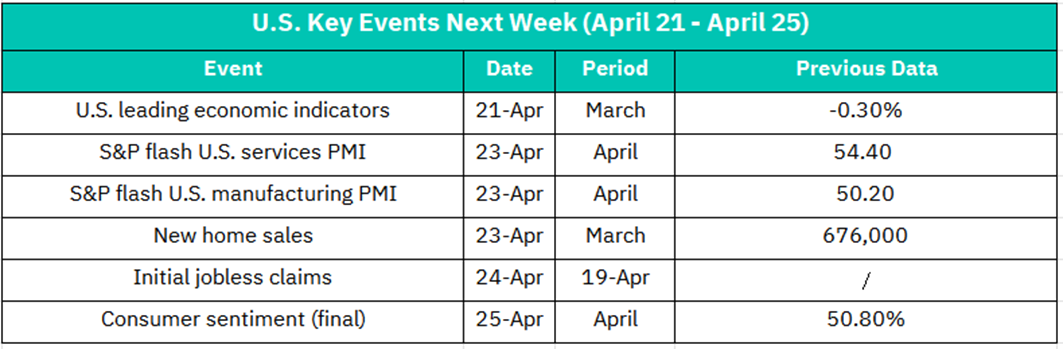
1.April 21– U.S. Leading Economic Indicators (March)
Previous: -0.30%
A continued decline may signal weakening economic momentum, raising recession fears. This could pressure cyclical sectors (e.g., industrials, materials) and weigh on broader market sentiment.
2. April 23 – S&P Flash U.S. Services PMI (April)
Previous: 54.40
A reading above 50 indicates expansion. A stronger-than-expected figure could boost confidence in the services sector (e.g., retail, hospitality), lifting related stocks. A drop below 54 might trigger concerns about slowing consumer activity.
– S&P Flash U.S. Manufacturing PMI (April)
Previous: 50.20
Manufacturing activity barely in expansion territory. A rise above 50.5 could signal recovery in industrial demand, benefiting tech and materials stocks. A dip below 50 (contraction) may spark sell-offs in manufacturing-heavy sectors.
– New Home Sales (March)
Previous: 676,000
Higher sales would reflect resilience in housing demand despite rate pressures, supporting homebuilders (e.g., D.R. Horton, Lennar) and mortgage lenders. A miss could drag down real estate and construction stocks.
3. April 24 – Initial Jobless Claims (19- April)
A sharp increase in claims might revive fears of labor market softening, pressuring consumer discretionary and financial stocks. Stable or lower claims could reinforce confidence in economic stability.
4. April 25– Consumer Sentiment Final (April)
Previous: 50.80%
Improved sentiment would signal stronger consumer spending outlook, favoring retail and travel stocks. A downward revision could heighten recession concerns, particularly for consumer-driven sectors.
Crypto ETF Technical Analysis:
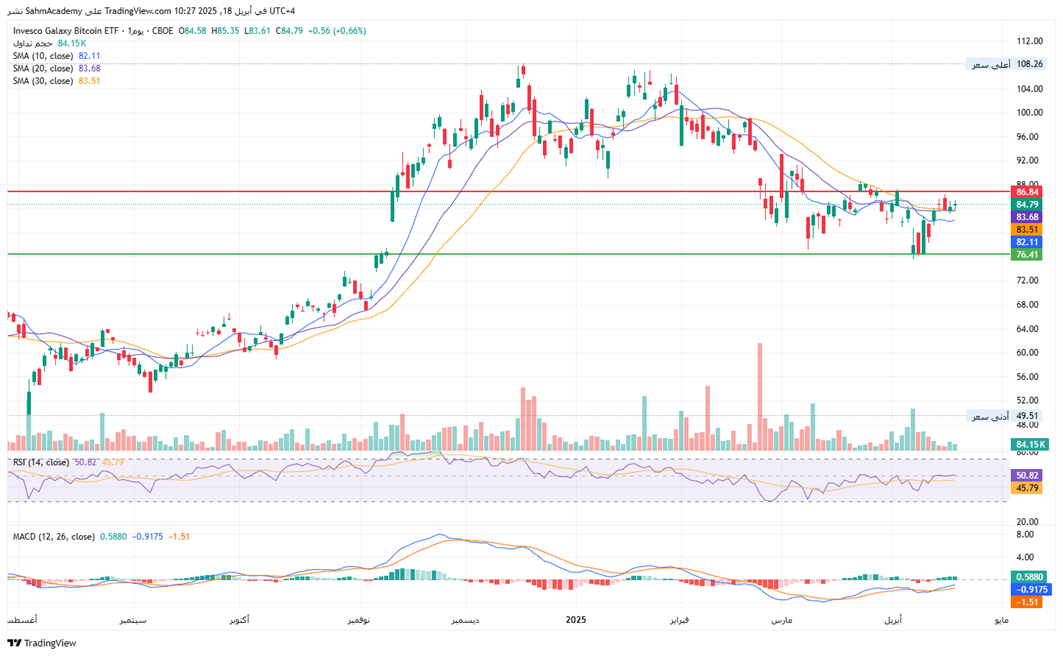
Invesco Galaxy Bitcoin ETF (BTCO) at $84.79, the price consolidating between support at $82.11 and resistance at $86.84. Since peaking at $108 in December 2024, BTCO has been in a downtrend but now shows signs of stabilization. The price is currently trading above the 10-day SMA ($82.11), 20-day SMA ($83.68), and 30-day SMA ($83.51), indicating short-term bullish momentum and potential for a trend reversal. The moving averages are flattening after the downtrend, signaling possible consolidation. The RSI stands at 50.82, which is in the midrange and does not indicate overbought or oversold conditions. The MACD shows mixed signals: while the MACD line (0.5880) is above the signal line (-0.9175), suggesting potential bullish momentum, the histogram (-1.51) remains negative. Volume currently stands at 84.15K, which is lower than during previous significant price movements, with distribution seen during the December-January tops and accumulation in recent bottoms.
Disclaimer:
Sahm is subject to the supervision and control of the CMA, pursuant to its license no. 22251-25 issued by CMA.
The Information presented above is for information purposes only, which shall not be intended as and does not constitute an offer to sell or solicitation for an offer to buy any securities or financial instrument or any advice or recommendation with respect to such securities or other financial instruments or investments. When making a decision about your investments, you should seek the advice of a professional financial adviser and carefully consider whether such investments are suitable for you in light of your own experience, financial position and investment objectives. The firm and its analysts do not have any material interests or conflicts of interest in any companies mentioned in this report.
Performance data provided is accurate and sourced from reliable platforms, including Argaam, TradingView, MarketWatch.
IN NO EVENT SHALL SAHM CAPITAL FINANCIAL COMPANY BE LIABLE FOR ANY DAMAGES, LOSSES OR LIABILITIES INCLUDING WITHOUT LIMITATION, DIRECT OR INDIRECT, SPECIAL, INCIDENTAL, CONSEQUENTIAL DAMAGES, LOSSES OR LIABILITIES, IN CONNECTION WITH YOUR RELIANCE ON OR USE OR INABILITY TO USE THE INFORMATION PRESENTED ABOVE, EVEN IF YOU ADVISE US OF THE POSSIBILITY OF SUCH DAMAGES, LOSSES OR EXPENSES.
