
We Value Your Feedback! Help us shape better content and experiences by participating in our survey. Join the Survey Now!
Saudi Market
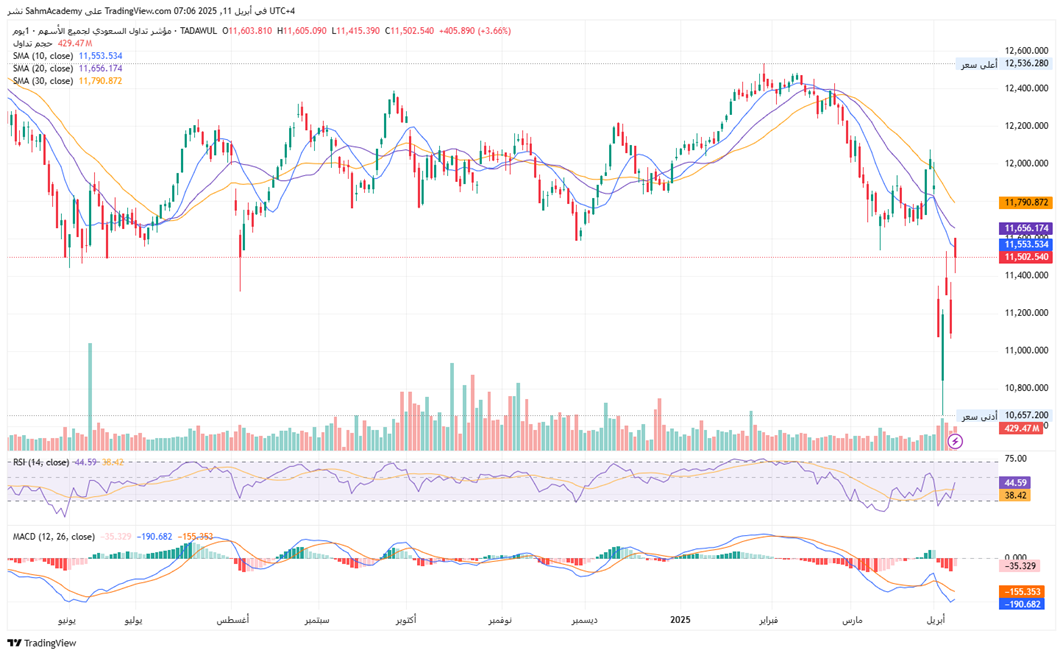
TASI Technical Analysis:
The Saudi TASI Index is currently trading at 11,502.54 points. Despite this rebound, the index remains entrenched in a downtrend from its February 2025 peak of 12,536 points. Technical indicators reveal a bearish alignment, as the price sits below all key moving averages—10-day SMA (11,553), 20-day SMA (11,656), and 30-day SMA (11,790)—indicating stacked overhead resistance. However, the recovery attempt is supported by elevated trading volume (429.47M shares), signaling increased participation. The RSI (14-day: 44.59) has crossed above its signal line (38.42), reflecting short-term buying pressure, yet remains below the neutral 50 threshold. Meanwhile, the MACD (12, 26) histogram is tentatively turning positive, though the MACD line (-190.68) remains deep in negative territory, casting doubt on the sustainability of the bounce. Key resistance levels are clustered at the 10-day SMA (11,553) and 30-day SMA (11,790); a decisive break above these could signal trend reversal. Downside risks persist, while the index exhibits short-term oversold recovery signals, the broader bearish trend remains intact.
TASI Index Weekly Market Summary (April 6 to April 10)
The TASI index rose by 3.84% and trading was active. The total turnover in 5 trading days reached 42.138 billion Saudi riyals, and the average daily trading volume exceeded 710,000 transactions.
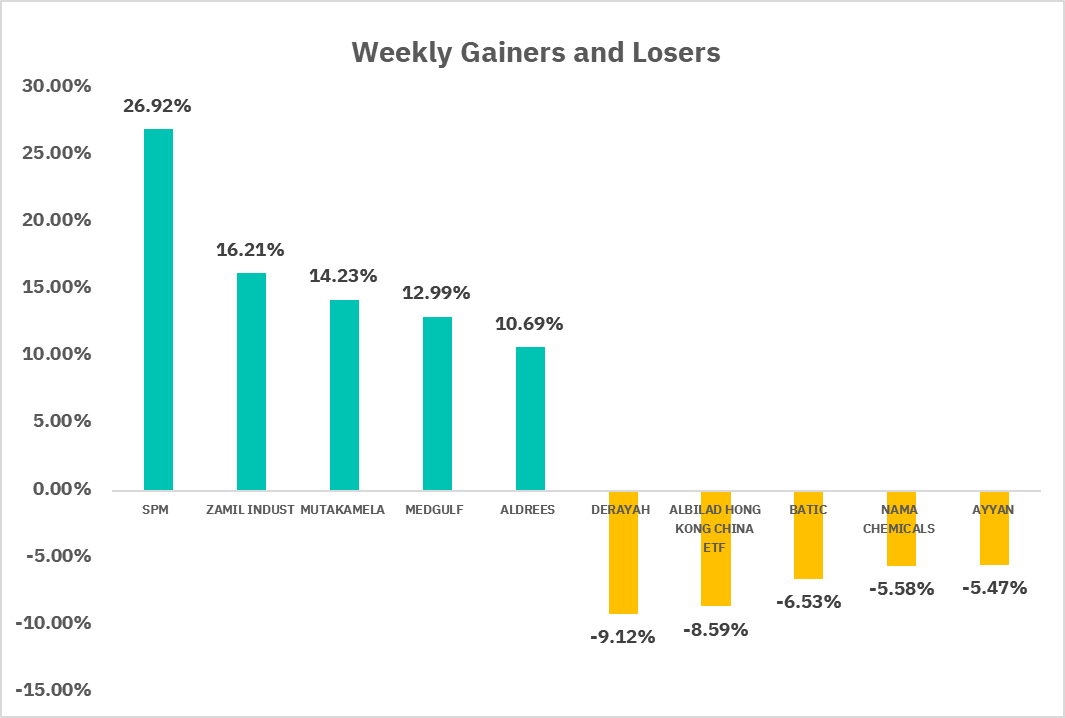
From the perspective of individual stock performance, 232 companies saw their stock prices rise this week, while 36 companies saw their stock prices fall. The companies with the highest increase included SPM, ZAMIL INDUST, MUTAKAMELA, with increases of 26.92%, 16.21%, and 14.23% respectively. The companies with the highest decline included DERAYAH , ALBILAD HONG KONG CHINA ETF, BATIC, with declines of 9.12%, 8.59%, and 6.53% respectively.
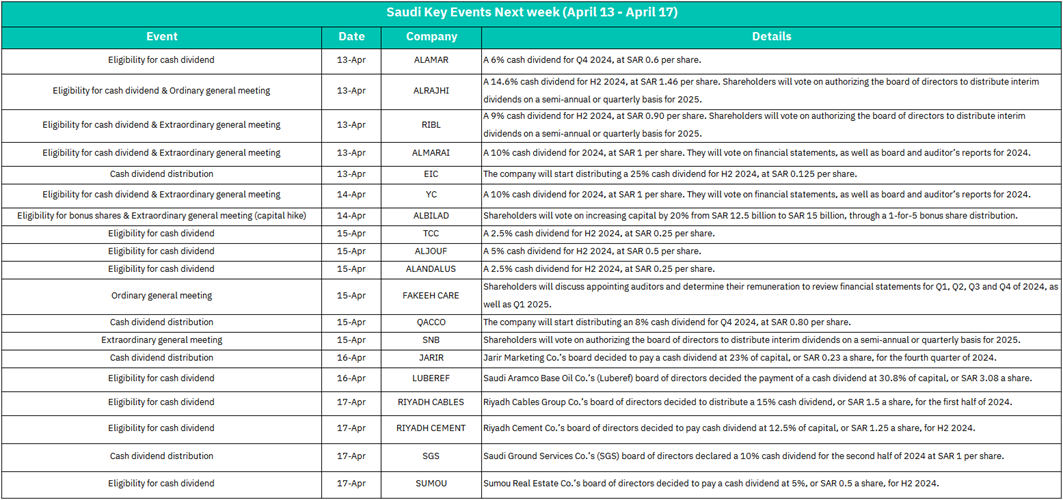
1.April 13– ALAMAR, ALRAJHI, RIBL, ALMARAI, EIC
Cash Dividend Eligibility/Distribution:
ALAMAR (6% Q4 2024), ALRAJHI (14.6% H2 2024), RIBL (9% H2 2024), ALMARAI (10% 2024), EIC (25% H2 2024).
General Meetings:
ALRAJHI, RIBL, ALMARAI: Shareholders to vote on interim dividend authorization for 2025 (likely boosting investor confidence in recurring payouts).
High dividend yields (e.g., ALRAJHI’s 14.6%) may attract income-focused investors, driving short-term demand for these stocks. ALMARAI’s approval of financial statements could reinforce trust in its governance.
2. April 14 – YC, ALBILAD
YC: 10% cash dividend for 2024; financial statement approval (neutral impact unless discrepancies arise).
ALBILAD: Proposal to increase capital by 20% (SAR 12.5B → SAR 15B) via 1-for-5 bonus shares.
ALBILAD’s capital hike could dilute EPS short-term but signals growth ambitions, potentially lifting sentiment. YC’s dividend payout unlikely to trigger volatility.
3. April 15 – TCC, ALJOUF, ALANDALUS, QACCO, SNB, FAKEEH CARE
Dividends: Smaller payouts (TCC 2.5%, ALJOUF 5%, ALANDALUS 2.5%, QACCO 8%).
General Meetings:
SNB: Vote on interim dividends for 2025 (positive for long-term shareholder returns).
FAKEEH CARE: Auditor appointments.
4. April 16 – JARIR, LUBEREF
JARIR: 23% cash dividend (SAR 0.22/share) for Q4 2024.
LUBEREF: 30.8% dividend (SAR 3.08/share) – one of the highest yields.
LUBEREF’s substantial payout may trigger a short-term price surge. JARIR’s consistent retail performance and dividend could sustain its trend.
5. April 17 – RIYADH CABLES, RIYADH CEMENT, SGS, SUMOU
Dividends: RIYADH CABLES (15% H1 2024), RIYADH CEMENT (12.5% H2 2024), SGS (10% H2 2024), SUMOU (5% H2 2024).
RIYADH CABLES and CEMENT’s above-average dividends may draw sector-specific interest. SGS’s payout aligns with expectations, while SUMOU’s lower yield may underwhelm.
U.S. Market
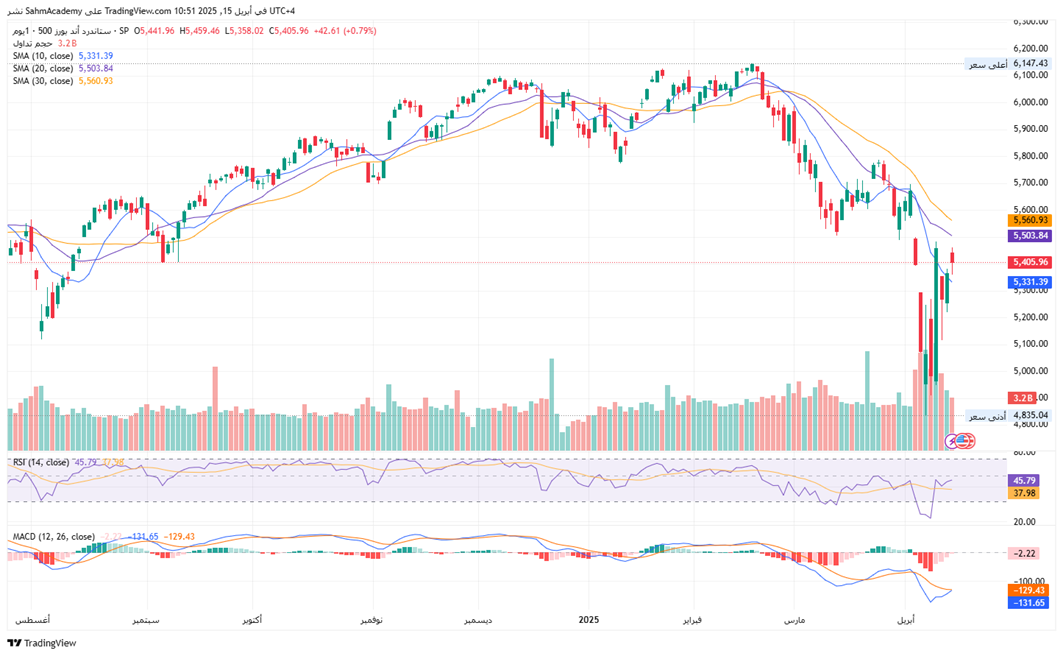
S&P500 Technical Analysis:
The S&P 500 is currently trading at 5,268.06, reflecting a significant downtrend since its peak at 6,147.43. The index is trading below all key moving averages, with the 10-day SMA at 5,373.74, 20-day SMA at 5,531.08, and 30-day SMA at 5,595.42, forming a bearish alignment and confirming the ongoing bear market. The 14-day RSI stands at 40.61, approaching oversold territory but still below the neutral 50 level, while showing a minor positive divergence as it crosses above its signal line. The MACD (12, 26) remains in negative territory, with the MACD line at -154.32 and the signal line at -124.99, indicating strong bearish momentum. Key support levels are at 5,200, while resistance levels are at 5,373.74 (10-day SMA). The technical outlook suggests that while short-term oversold conditions could lead to a technical bounce, the overall trend remains bearish until the index can reclaim its moving averages. Traders should exercise caution, as the index faces significant overhead resistance, though the divergence between price and RSI may signal waning downside momentum.
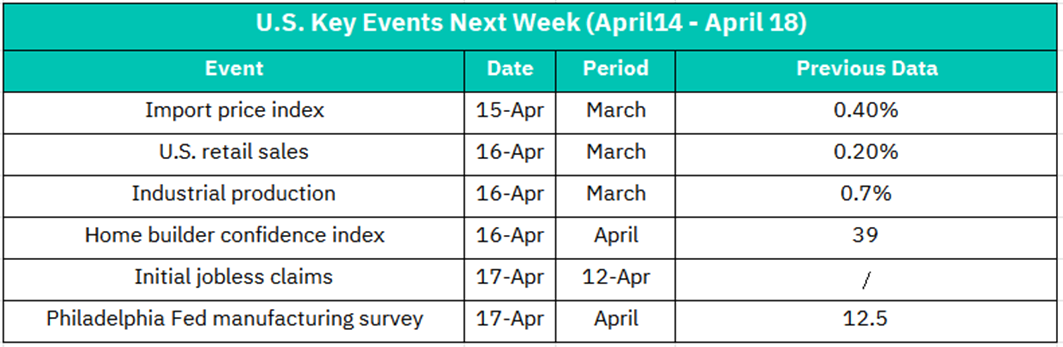
1.April 15– Import Price Index (March)
Data measures changes in the prices of imported goods, which can reflect inflationary pressures. A significant increase might signal higher inflation, potentially leading to concerns about tighter monetary policy. This could negatively impact equity markets, especially sectors sensitive to rising interest rates.
2. April 16 – U.S. Retail Sales (March)
Retail sales are a key indicator of consumer spending, which drives a large portion of U.S. GDP. Strong retail sales data could boost confidence in economic growth, potentially lifting equity markets, particularly consumer discretionary and retail sectors. Weak data, however, might signal slowing consumer demand, pressuring equities.
– Industrial Production (March)
This measures manufacturing, mining, and utility output. Higher industrial production could indicate a robust manufacturing sector, benefiting industrial and materials stocks. Conversely, a decline might raise concerns about economic slowdown.
– Home Builder Confidence Index (April)
This gauge of builder sentiment reflects housing market health. A higher index could indicate optimism in the housing sector, supporting homebuilding and related stocks. A lower reading might suggest caution, potentially weighing on real estate and construction sectors.
3. April 17 – Initial Jobless Claims (12- April)
Data tracks new unemployment claims. A rise in claims might signal weakening labor market conditions, negatively impacting equities, especially sectors tied to employment. A decline could reinforce confidence in labor market resilience.
– Philadelphia Fed Manufacturing Survey (April)
This regional manufacturing index reflects factory activity. A higher reading could indicate expansion in the manufacturing sector, supporting industrial and materials stocks. A lower reading might suggest contraction, pressuring related sectors.
Crypto ETF Technical Analysis:
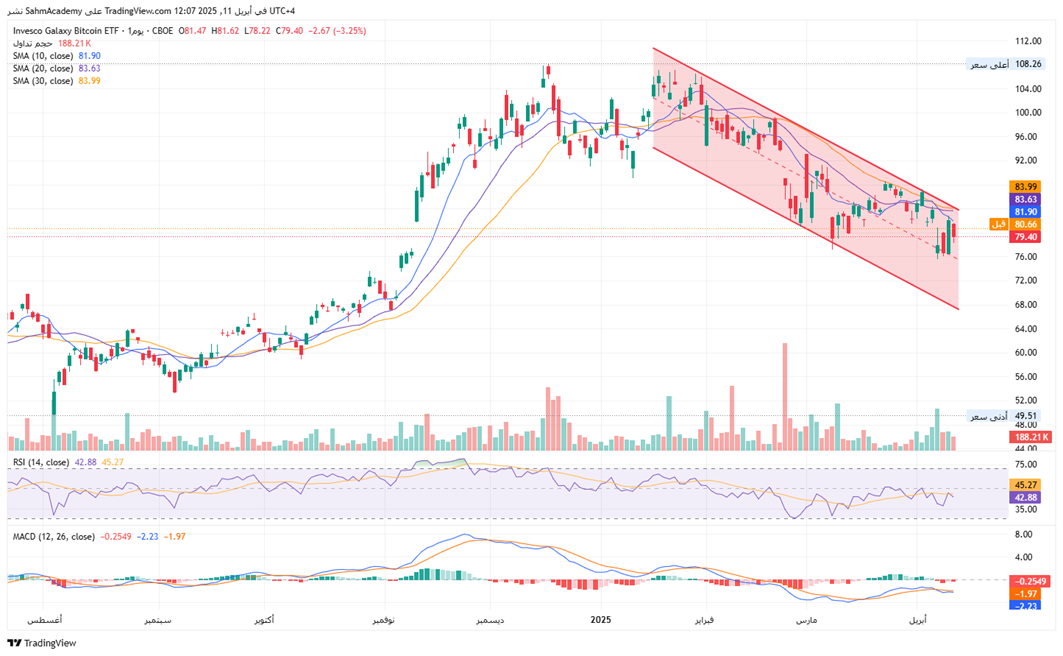
BTCO ETF is currently trading at $79.40, reflecting a clear downtrend since January 2025, trading within a well-defined descending channel. The price is testing the lower boundary of this channel, which could act as support. The bearish alignment of the moving averages (price < SMA10 < SMA20 < SMA30) confirms the downtrend and suggests overhead resistance at each of these levels. The current trading volume of 188.21K is relatively high, indicating increased participation during this downward movement, with spikes in volume on down days suggesting distribution rather than accumulation. The 14-day RSI stands at 42.88, approaching but not yet in oversold territory, and remains below its signal line, confirming bearish momentum. The MACD (12, 26) configuration shows bearish momentum accelerating, as the MACD line is falling below its signal line. Key support levels are at the channel lower boundary (~$78-79), while resistance levels are at the channel upper boundary (~$86-87). The technical outlook suggests that BTCO is in a confirmed downtrend with bearish technical indicators across multiple timeframes. The ETF is currently testing a critical support level at the lower boundary of its descending channel. If this support fails, further downside momentum could accelerate toward the next major support around the psychological $75 level. For traders, current levels present high risk in either direction. The overall trend remains bearish until BTCO can break above its moving averages and the upper boundary of the descending channel.
Disclaimer:
Sahm is subject to the supervision and control of the CMA, pursuant to its license no. 22251-25 issued by CMA.
The Information presented above is for information purposes only, which shall not be intended as and does not constitute an offer to sell or solicitation for an offer to buy any securities or financial instrument or any advice or recommendation with respect to such securities or other financial instruments or investments. When making a decision about your investments, you should seek the advice of a professional financial adviser and carefully consider whether such investments are suitable for you in light of your own experience, financial position and investment objectives. The firm and its analysts do not have any material interests or conflicts of interest in any companies mentioned in this report.
Performance data provided is accurate and sourced from reliable platforms, including Argaam, TradingView, MarketWatch.
IN NO EVENT SHALL SAHM CAPITAL FINANCIAL COMPANY BE LIABLE FOR ANY DAMAGES, LOSSES OR LIABILITIES INCLUDING WITHOUT LIMITATION, DIRECT OR INDIRECT, SPECIAL, INCIDENTAL, CONSEQUENTIAL DAMAGES, LOSSES OR LIABILITIES, IN CONNECTION WITH YOUR RELIANCE ON OR USE OR INABILITY TO USE THE INFORMATION PRESENTED ABOVE, EVEN IF YOU ADVISE US OF THE POSSIBILITY OF SUCH DAMAGES, LOSSES OR EXPENSES.
