
We Value Your Feedback! Help us shape better content and experiences by participating in our survey. Join the Survey Now!
Saudi Market
TASI Technical Analysis:
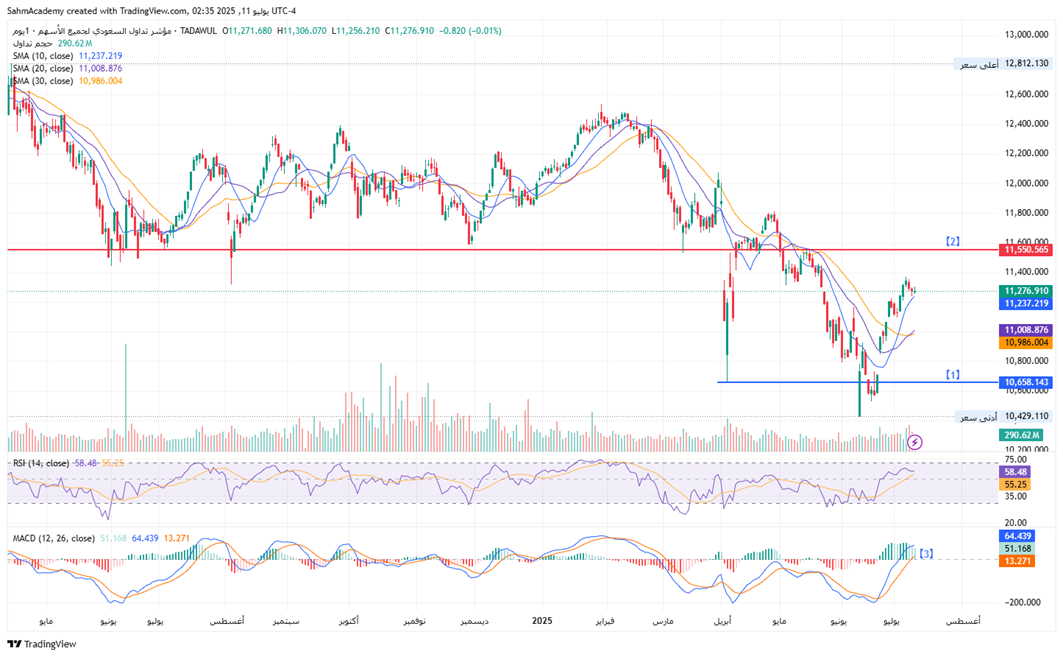
The TASI is showing signs of recovery, trading above all key moving averages (10/20/30-day SMAs) with a golden cross formation indicating near-term bullish momentum. The RSI (58.48) suggests room for further upside without being overbought.
[1] Technical improvements include a potential double-bottom reversal pattern near 10,658 and rising volume on up days – signaling strengthening institutional confidence in the rebound despite recent volatility.
[2] Immediate resistance at 11,550 remains critical; a decisive break above this resistance would significantly reinforce the bullish case toward 12,000.
[3] MACD remains in bearish territory, and global uncertainties warrant caution.
Overall sentiment is cautiously optimistic but requires vigilance given elevated market volatility.
TASI Index Weekly Market Summary (July 6 to July 10)
The TASI index increased by 0.34%. With a trading week of 5 days, the total trading volume reached 25 billion Saudi Riyals, averaging 5.1 billion per day.
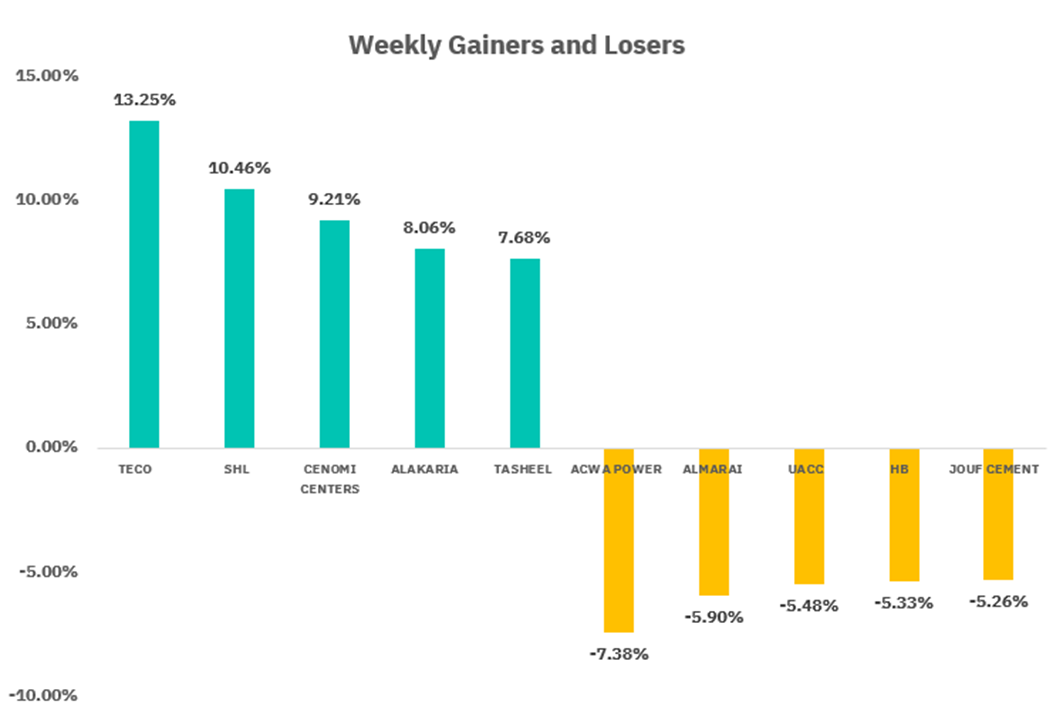
From the perspective of individual stock performance, 123 companies saw their stock prices rise this week, while 142 companies saw their stock prices fall. The companies with the highest increase included TECO, SHL, CENOMI CENTERS, with increases of 13.25%, 10.46%, and 9.21% respectively. The companies with the highest decline included ACWA POWER, ALMARAI, UACC, with declines of 7.38%, 5.90%, and 5.48% respectively.
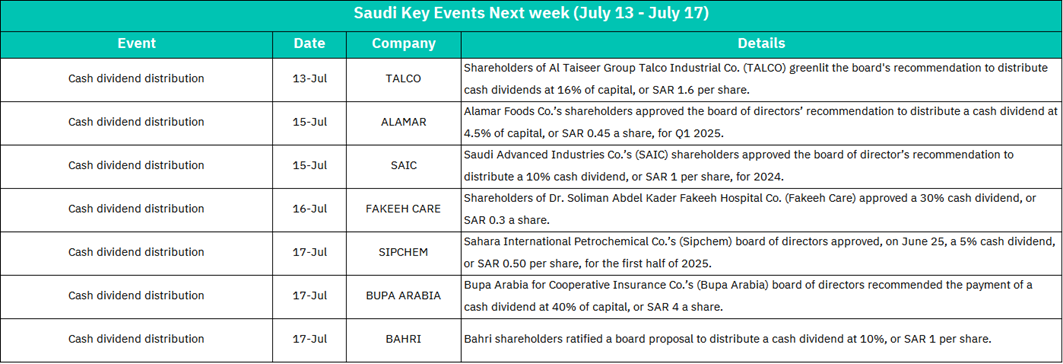
July 13:
TALCO
Cash dividend distribution (16% of capital, SAR 1.6/share).
Likely positive sentiment as high dividends signal strong financial health, potentially boosting investor confidence in the industrials sector. Short-term price volatility possible near the ex-dividend date.
July 15:
ALAMAR
Q1 2025 dividend (4.5%, SAR 0.45/share).
SAIC
2024 dividend (10%, SAR 1/share).
Mixed reactions; SAIC’s higher payout may attract income-focused investors, while ALAMAR’s modest dividend could reflect sector-specific challenges (consumer goods).
July 16:
FAKEEH CARE
Dividend distribution (30%, SAR 0.3/share).
Significant due to high yield (30%), possibly driving short-term buying interest in healthcare stocks. However, post-payment price correction typical.
July 17:
BUPA ARABIA
Dividend proposal (40%, SAR 4/share).
Major attention expected—40% dividend signals robust profitability in insurance, likely spurring sector momentum.
SIPCHEM
H1 2025 dividend (5%, SAR 0.50/share).
BAHRI
Dividend (10%, SAR 1/share).
Solid payouts may bolster transport and petrochemical sectors, though SIPCHEM’s lower yield could limit enthusiasm.
U.S. Market
S&P500 Technical Analysis:
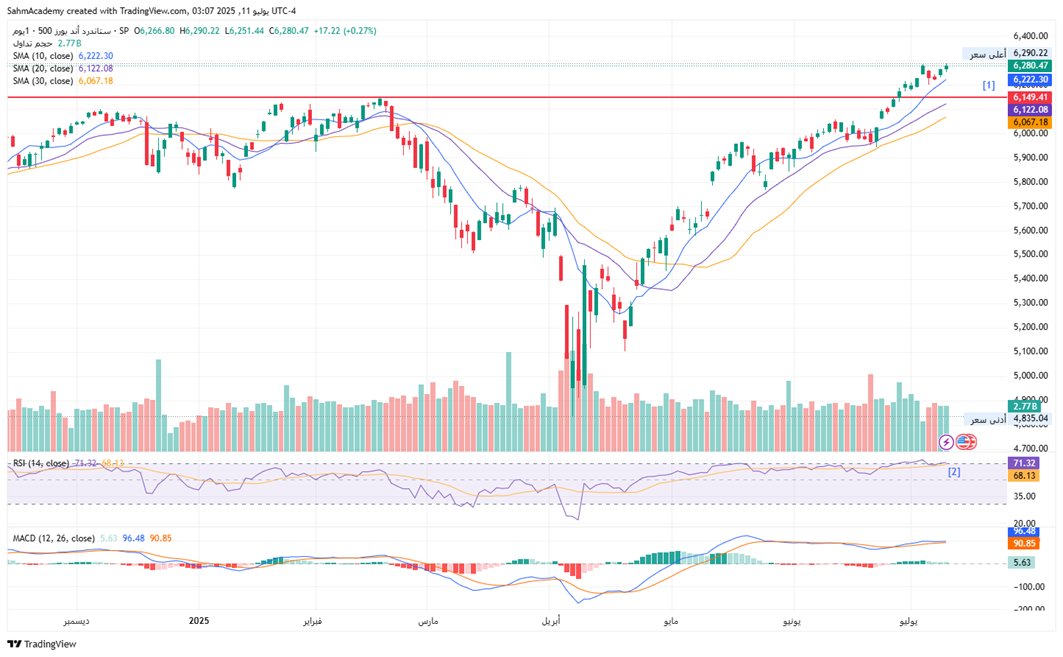
The S&P 500 is trading at historic highs near 6,280, exhibiting robust technical strength with a sustained parabolic uptrend since March 2024. The index maintains decisive positioning above all key moving averages (10/20/30-day SMAs) in perfect bullish alignment, while MACD confirmation and higher volume on up days validate the momentum.
[1] Recent breakouts above 6,149 resistance and clear ascending channel patterns suggest potential continuation toward 6,400-6,500, supported by strong corporate earnings and favorable monetary policy.
[2] Despite the bullish structure, RSI at 71.32 signals overbought conditions that may trigger short-term consolidation or a 3-5% pullback. The parabolic ascent raises sustainability concerns, with key support at 6,120 (20-day SMA).
Maintain cautious optimism but prepare for increased volatility, reducing exposure according to risk tolerance (40-80% equity allocation).
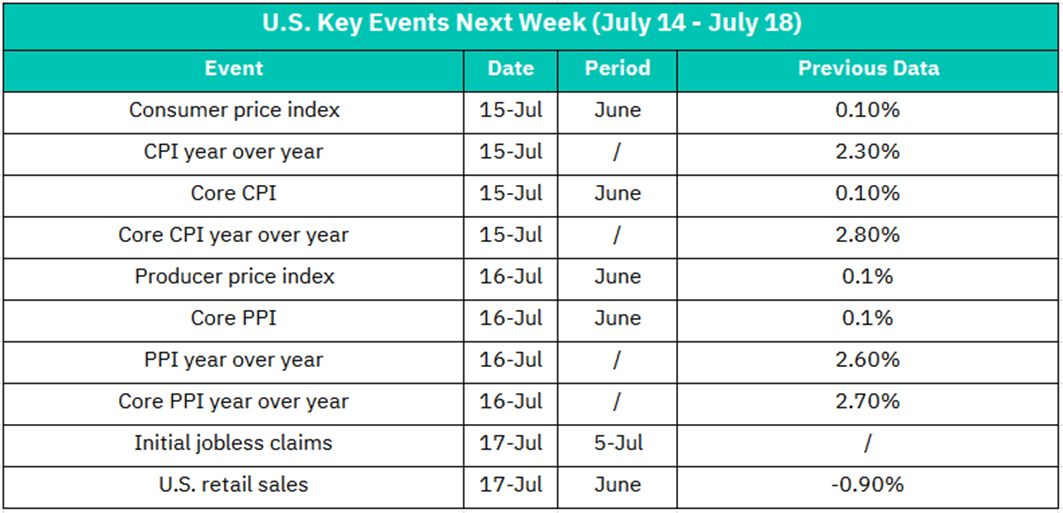
July 15:
CPI Data: June MoM (prev: 0.1%), YoY (prev: 2.3%)
Core CPI: June MoM (prev: 0.1%), YoY (prev: 2.8%)
Below expectations: Likely rally in equities (especially tech/growth stocks) as rate-cut bets rise.
Above 2.5% YoY: Potential sell-off; reinforces "higher-for-longer" rates narrative.
Core CPI >2.5% could trigger bond yield spikes.
July 16:
PPI & Core PPI: June MoM (both prev: 0.1%)
PPI YoY (prev: 2.6%), Core PPI YoY (prev: 2.7%)
Weak PPI: Supports disinflation story, bullish for S&P 500.
Strong PPI: May amplify CPI-driven volatility; industrials/energy sectors at risk.
July 17:
Retail Sales (June): prev: -0.9%
Jobless Claims (July 5 week)
Retail Sales rebound (>0.5%): Boosts consumer cyclicals (XLY), eases recession fears.
Second consecutive decline: Stocks may slide; utilities/staples (defensives) gain.
Jobless Claims >240K: Reinforces labor cooling, increases rate-cut odds (bullish).
Crypto ETF Technical Analysis:
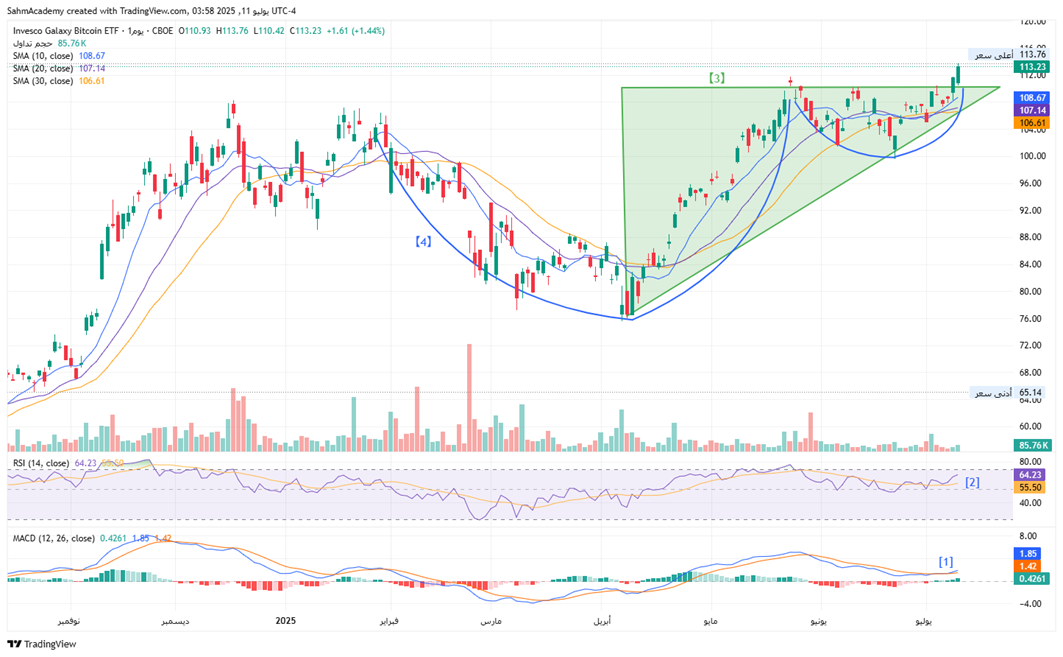
BTCO trades at $113.23. The ETF maintains a robust bullish trend since April 2025 (lows ~$76-78), supported by decisive positioning above all key moving averages (10/20/30-day SMAs) that show bullish alignment and positive slopes.
[1] Technical indicators confirm strength: MACD exhibits a confirmed bullish crossover with positive histogram.
[2] RSI (64.23) suggests further upside potential before overbought territory. Volume patterns indicate institutional conviction.
Completed bullish chart formations (ascending triangle[3], cup-and-handle[4]) project upside targets toward $118-$125.
While the structure favors continuation, near-term caution is warranted at resistance with RSI approaching overbought levels.
Disclaimer:
Sahm is subject to the supervision and control of the CMA, pursuant to its license no. 22251-25 issued by CMA.
The Information presented above is for information purposes only, which shall not be intended as and does not constitute an offer to sell or solicitation for an offer to buy any securities or financial instrument or any advice or recommendation with respect to such securities or other financial instruments or investments. When making a decision about your investments, you should seek the advice of a professional financial adviser and carefully consider whether such investments are suitable for you in light of your own experience, financial position and investment objectives. The firm and its analysts do not have any material interests or conflicts of interest in any companies mentioned in this report.
Performance data provided is accurate and sourced from reliable platforms, including Argaam, TradingView, MarketWatch.
IN NO EVENT SHALL SAHM CAPITAL FINANCIAL COMPANY BE LIABLE FOR ANY DAMAGES, LOSSES OR LIABILITIES INCLUDING WITHOUT LIMITATION, DIRECT OR INDIRECT, SPECIAL, INCIDENTAL, CONSEQUENTIAL DAMAGES, LOSSES OR LIABILITIES, IN CONNECTION WITH YOUR RELIANCE ON OR USE OR INABILITY TO USE THE INFORMATION PRESENTED ABOVE, EVEN IF YOU ADVISE US OF THE POSSIBILITY OF SUCH DAMAGES, LOSSES OR EXPENSES.
