
We Value Your Feedback! Help us shape better content and experiences by participating in our survey. Join the Survey Now!
Saudi Market
TASI Technical Analysis:
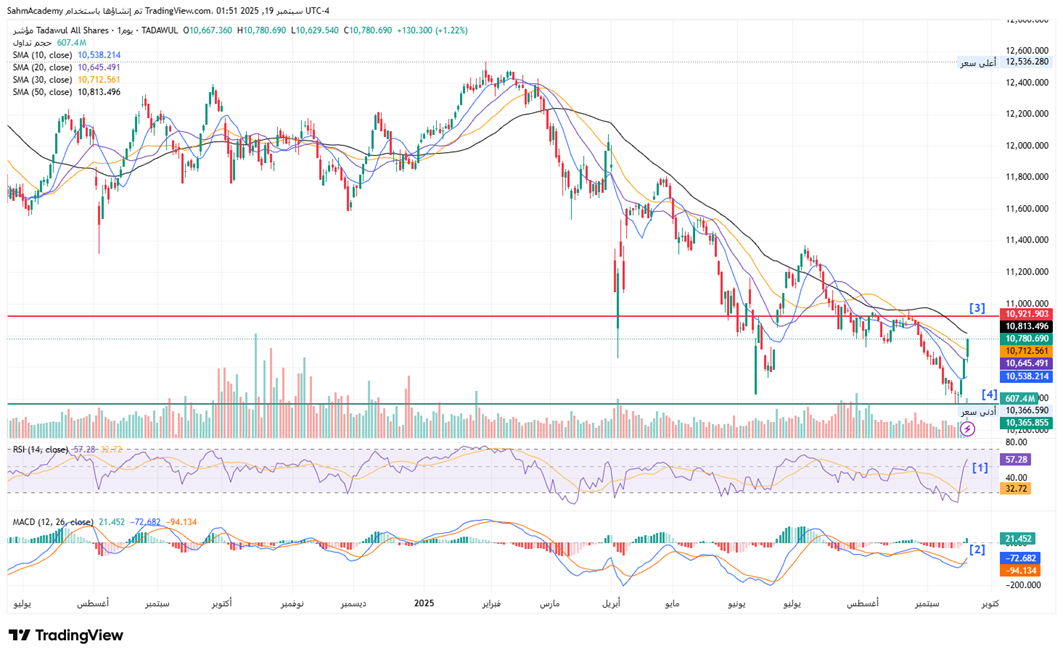
The index currently trades at 10,780.690, having broken below multiple critical support levels and moving averages throughout this decline. The price action shows a clear bearish market structure characterized by lower highs and lower lows, with the 10-day SMA at 10,538.214, 20-day SMA at 10,645.491, and 30-day SMA at 10,712.161 all sloping downward and acting as dynamic resistance levels. The recent price movement demonstrates a brief consolidation phase near the 10,800 level, but the overall trend remains decisively negative.
[1] The momentum indicators paint a mixed but cautiously oversold picture that warrants attention from both bears and potential bottom-fishers. The RSI reading of 57.28 has recovered from oversold territory below 30 reached during the recent sell-off, indicating a temporary relief bounce rather than a trend reversal.
[2] The MACD at -72.68 shows a bullish crossover above its signal line at -94.13, though both lines remain in negative territory, suggesting the current move is more of a bear market rally than a genuine reversal signal. The histogram at 21.45 confirms weakening downward momentum but hasn't yet turned positive.
[3] Key resistance levels clustered around the 10,921.
[4] Immediate support support at 10,366.590.
For the bearish trend to reverse, TASI would need to break above the psychological 11,000 resistance level and reclaim the 50-day moving average with conviction.
TASI Index Weekly Market Summary (September 14 to September 18)
The TASI index increased by 3.32%. With a trading week of 5 days, the total trading volume reached 34 billion Saudi Riyals, averaging 6.9 billion per day.
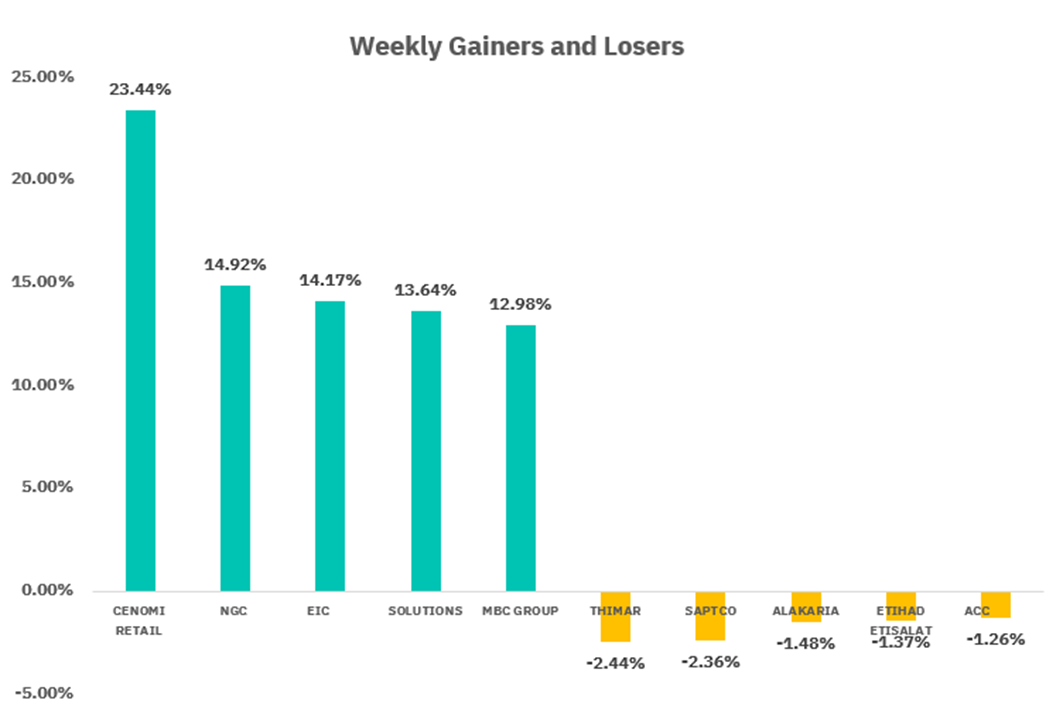
From the perspective of individual stock performance, 255 companies saw their stock prices rise this week, while 20 companies saw their stock prices fall. The companies with the highest increase included CENOMI RETAIL, NGC, EIC, with increases of 23.44%, 14.92%, and 14.17% respectively. The companies with the highest decline included THIMAR, SAPTCO, ALAKARIA with declines of 2.44%, 2.36%, and 1.48% respectively.
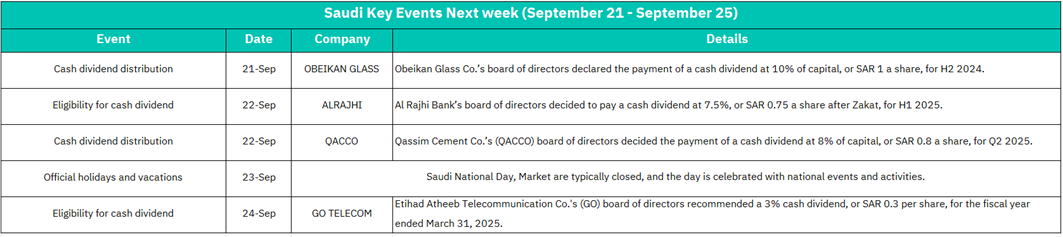
September 21:
OBEIKAN GLASS: Cash dividend distribution at 10% of capital (SAR 1 per share) for H2 2024
Market Impact:
The dividend payout will provide immediate cash returns to shareholders, potentially supporting the stock price. However, the ex-dividend effect may create temporary downward pressure on the share price equal to the dividend amount. This could generate moderate trading volume as income-focused investors may show interest.
September 22:
Al Rajhi: Eligibility for 7.5% cash dividend (SAR 0.75 per share after zakat) for H1 2025
QACCO: Cash dividend distribution of 8% of capital (SAR 0.8 per share) for H1 2025
Market Impact:
As one of the largest and most liquid stocks on Tadawul, Al Rajhi Bank’s dividend eligibility often attracts retail and institutional buying interest from income-focused investors. Positive effect on QACCO’s stock price due to dividend-seeking behavior. May also lift sentiment in the cement sector, which is often sensitive to dividend announcements.
September 23:
Saudi National Day: Official holiday - Market closed
September 24:
GO TELECOM (Etihad Atheeb): Eligibility for 3% cash dividend (SAR 0.3 per share) for fiscal year ended March 31, 2025
Market Impact:
This dividend announcement will likely provide moderate support for GO Telecom shares and may positively influence the telecommunications sector. Given the smaller dividend yield compared to banking and cement sectors, the impact will be more contained but still supportive for income-seeking investors.
U.S. Market
S&P500 Technical Analysis:
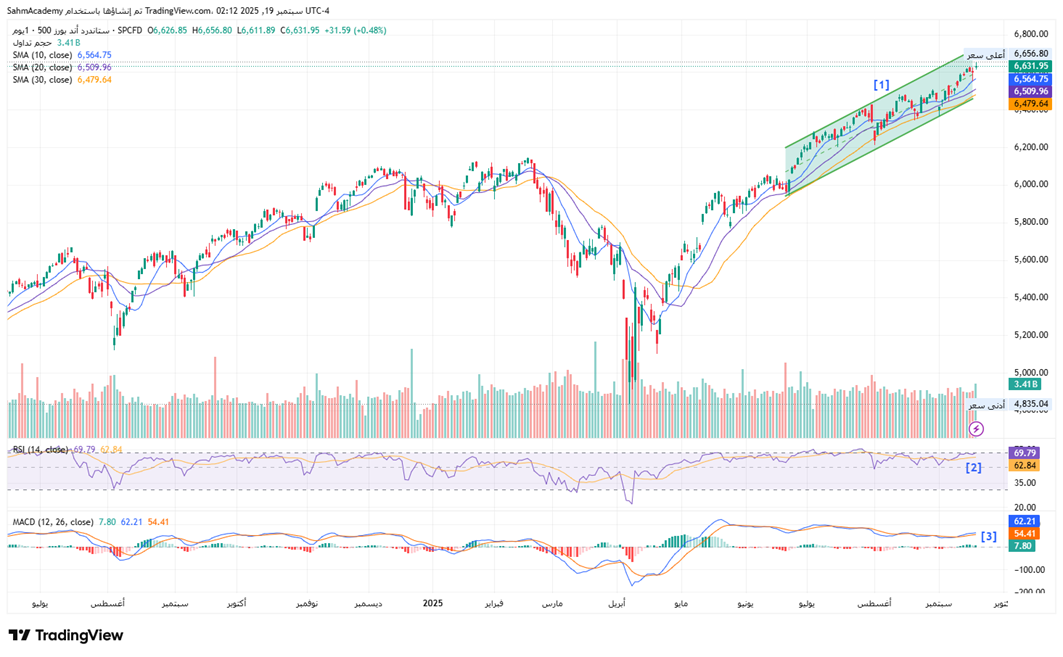
The S&P 500 Index technical analysis [1] reveals a remarkably bullish market structure that has maintained its upward trajectory, currently trading at 6,631.95, just slightly below its all-time high of 6,656.80. All key moving averages are properly aligned in a bullish formation - the 10-day SMA at 6,564.75, 20-day SMA at 6,509.96, and 30-day SMA at 6,479.64 are stacked in ascending order below the current price, providing multiple layers of dynamic support. This technical configuration suggests institutional money continues to accumulate positions on any minor pullbacks, with the recent consolidation near the 6,600 level appearing more like a healthy pause to digest gains rather than distribution. The volume patterns support this thesis, showing relatively normal trading activity without the surge in selling volume that typically accompanies major tops.
[2] From a momentum perspective, the technical indicators present a nuanced picture that requires careful interpretation within the context of this strong uptrend. The RSI reading of 69.79 sits just below the overbought threshold of 70, indicating the market has room to run higher without becoming dangerously extended - this "almost overbought" condition often occurs during the most profitable phases of bull markets where prices can remain elevated for extended periods.
[3] The MACD configuration with the signal line at 54.41 below the MACD line at 62.21, creating a histogram reading of 7.80, suggests some near-term momentum divergence that could lead to a brief consolidation or shallow pullback toward the 6,500-6,550 zone.
However, given the index's position near all-time highs and the absence of any significant distribution patterns, this appears to be a bull market experiencing normal rotation rather than a major top formation. For the bullish thesis to remain intact, the S&P 500 needs to hold above the 6,450 level on any pullback, with a decisive break above 6,700 likely triggering the next leg higher toward the psychological 7,000 level.
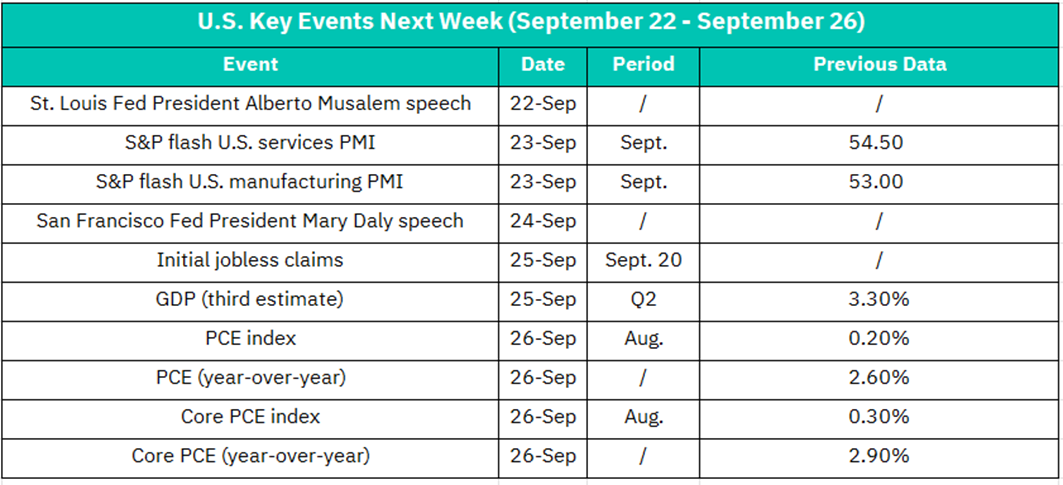
September 22:
St. Louis Fed President Alberto Musalem Speech
Market Impact:
Federal Reserve speeches typically provide insights into monetary policy direction and economic outlook. Given the current economic environment, markets will closely watch for any hints about future interest rate decisions, inflation concerns, or labor market views. Dovish comments could boost equity markets, while hawkish rhetoric might pressure stocks and strengthen the dollar. Volatility in interest rate-sensitive sectors like financials and REITs is likely.
September 23:
S&P Flash U.S. Services PMI (September) - Previous: 54.50
S&P Flash U.S. Manufacturing PMI (September) - Previous: 53.00
Market Impact:
These leading economic indicators will provide crucial insights into business activity momentum. Services PMI above 50 suggests continued expansion in the dominant sector of the U.S. economy. A reading below the previous 54.50 could signal economic softening, potentially pressuring cyclical stocks and supporting defensive sectors. Manufacturing PMI will impact industrial and materials stocks directly. Strong readings above expectations could boost market confidence and support pro-cyclical trades.
September 24:
San Francisco Fed President Mary Daly Speech
Market Impact:
Another Fed official speech adds to the monetary policy narrative from Monday. Markets will analyze consistency in messaging between Fed officials. Any divergence in views could create uncertainty, while unified messaging might reinforce market expectations. Technology stocks, being interest rate-sensitive, may see particular volatility. Bond markets will likely react more immediately than equities.
September 25:
Initial Jobless Claims (September 20 week)
GDP Third Estimate (Q2) - Previous: 3.30%
Market Impact:
The GDP final reading will confirm economic growth strength for Q2, though it's backward-looking. Any significant revision from 3.30% could influence Fed policy expectations. Initial jobless claims remain a timely labor market indicator - rising claims might support dovish Fed expectations and boost growth stocks, while declining claims could pressure rate-sensitive sectors. Combined, these data points will shape September month-end positioning and Q3 economic outlook.
September 26:
PCE Index (August) - Previous: 0.20%
PCE Year-over-Year - Previous: 2.60%
Core PCE Index (August) - Previous: 0.30%
Core PCE Year-over-Year - Previous: 2.90%
Market Impact:
The Fed's preferred inflation measure will be the week's most critical data point. Core PCE near 2.90% remains above the Fed's 2% target, making this release pivotal for monetary policy expectations. A higher-than-expected reading could reignite inflation concerns, pressuring growth stocks and boosting financial sector expectations for sustained higher rates. Lower readings might support the "soft landing" narrative, benefiting risk assets. Month-end and quarter-end positioning will amplify market reactions, particularly affecting duration-sensitive sectors like technology and utilities.
Crypto ETF Technical Analysis:
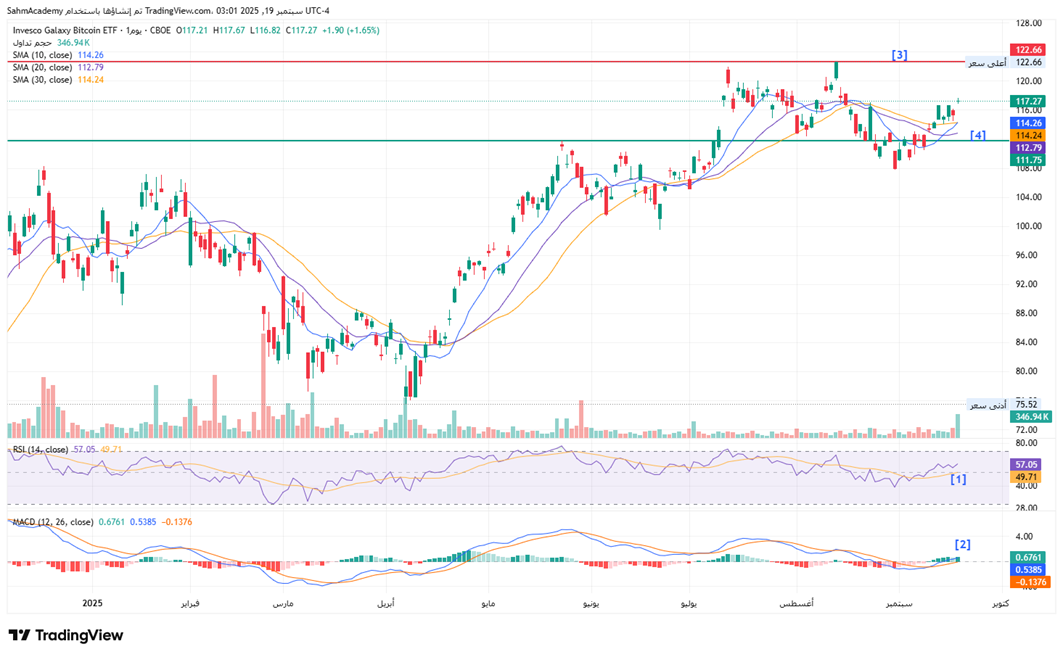
BTCO trading at $117.27, the ETF has demonstrated exceptional strength by maintaining a robust uptrend that began from the significant low of $75.52 earlier this year. The price action exhibits a classic ascending pattern characterized by a series of higher highs and higher lows, with the most recent consolidation phase forming a constructive sideways pattern between $112 and $122. This consolidation appears to be a healthy accumulation zone, as evidenced by the price holding firmly above all major moving averages - the 10-day SMA at $114.26, 20-day SMA at $112.79, and 30-day SMA at $114.24. The tight clustering of these moving averages just below the current price creates a strong support confluence zone that should act as a springboard for the next leg higher. The volume profile reveals increasing participation during upward moves and diminishing volume on pullbacks, a classic sign of institutional accumulation that typically precedes significant breakouts.
[1] The momentum indicators provide additional confirmation of the bullish thesis while also highlighting some near-term considerations for tactical positioning. The RSI reading of 57.05 sits comfortably in neutral territory, having pulled back from overbought conditions above 70, which actually strengthens the technical setup by resetting the oscillator for another potential push higher without the burden of extreme overbought conditions.
[2] The MACD line at 0.538 above the signal line at -0.1376, producing a histogram reading of 0.676, suggesting some short-term momentum loss that aligns with the current consolidation phase. However, this minor divergence should be viewed within the context of the strong primary uptrend - such momentum resets are typical and healthy during sustained bull markets.
[3] For the bullish scenario to accelerate, BTCO needs to decisively break above the $122.66 resistance level (the recent high) with accompanying volume expansion, which would likely trigger a measured move toward the $130-135 zone.
[4] The critical support level to maintain the bullish structure sits at $112, and any sustained break below this level would suggest a deeper correction toward the $105-108 area.
Disclaimer:
Sahm is subject to the supervision and control of the CMA, pursuant to its license no. 22251-25 issued by CMA.
The Information presented above is for information purposes only, which shall not be intended as and does not constitute an offer to sell or solicitation for an offer to buy any securities or financial instrument or any advice or recommendation with respect to such securities or other financial instruments or investments. When making a decision about your investments, you should seek the advice of a professional financial adviser and carefully consider whether such investments are suitable for you in light of your own experience, financial position and investment objectives. The firm and its analysts do not have any material interests or conflicts of interest in any companies mentioned in this report.
Performance data provided is accurate and sourced from reliable platforms, including Argaam, TradingView, MarketWatch.
IN NO EVENT SHALL SAHM CAPITAL FINANCIAL COMPANY BE LIABLE FOR ANY DAMAGES, LOSSES OR LIABILITIES INCLUDING WITHOUT LIMITATION, DIRECT OR INDIRECT, SPECIAL, INCIDENTAL, CONSEQUENTIAL DAMAGES, LOSSES OR LIABILITIES, IN CONNECTION WITH YOUR RELIANCE ON OR USE OR INABILITY TO USE THE INFORMATION PRESENTED ABOVE, EVEN IF YOU ADVISE US OF THE POSSIBILITY OF SUCH DAMAGES, LOSSES OR EXPENSES.
