
We Value Your Feedback! Help us shape better content and experiences by participating in our survey. Join the Survey Now!
Saudi Market
TASI Technical Analysis:
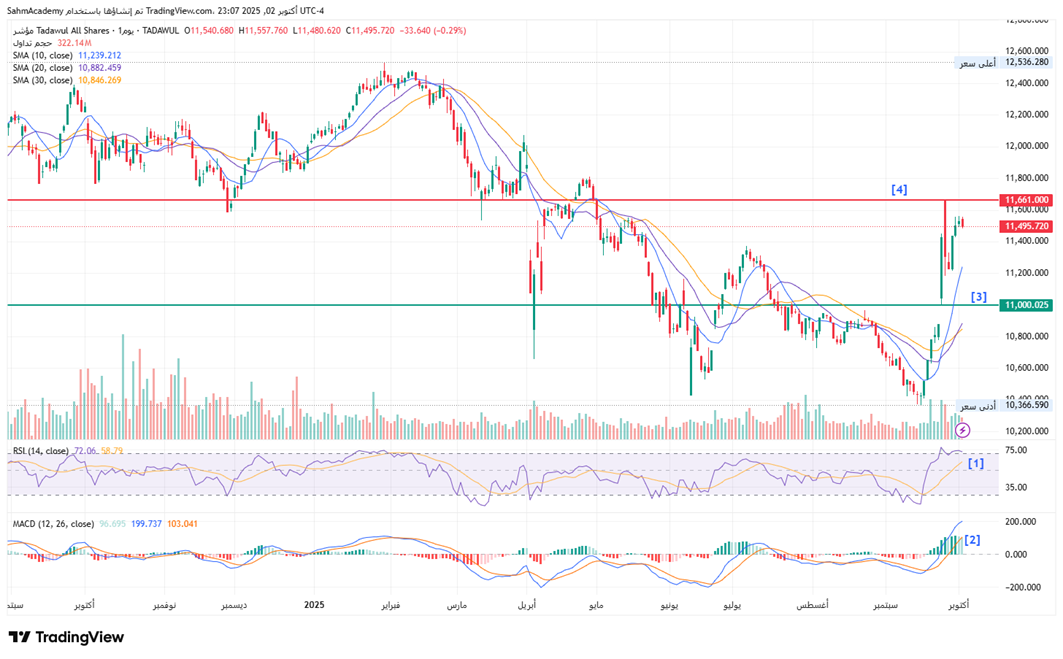
The TADAWUL All Shares Index is currently trading at 11,495.72, showing signs of momentum exhaustion near critical resistance levels. Price action reveals a double-top formation near 11,601, with the recent rejection suggesting potential weakness. The moving average structure shows the price trading above the SMA 10 (11,239), SMA 20 (10,882), and SMA 30 (10,846), confirming the short-term uptrend remains intact, though the flattening of these averages indicates diminishing upward momentum. Volume patterns during the recent rally have been notably lighter compared to the selloff periods earlier in the year, raising concerns about the sustainability of this move.
[1] From a momentum perspective, the RSI at 72.06 is clearly in overbought territory, having crossed above the 70 threshold, which historically has preceded corrective pullbacks in this index.
[2] The MACD histogram (12, 26) shows expansion in positive territory, confirming bullish momentum, but the indicator appears to be reaching extremes that typically precede consolidation or reversal.
[3] Key support levels are identified at 11,000.
[4] The immediate resistance remains at 11,661.
Given the overbought conditions and weakening volume profile, a period of consolidation or a pullback toward the 11,000-11,200 support zone would be healthy for the market structure before any sustained breakout attempt above 11,600 can materialize.
TASI Index Weekly Market Summary (September 28 to October 2)
The TASI index increased by 2.37%. With a trading week of 5 days, the total trading volume reached 33 billion Saudi Riyals, averaging 6.6 billion per day.
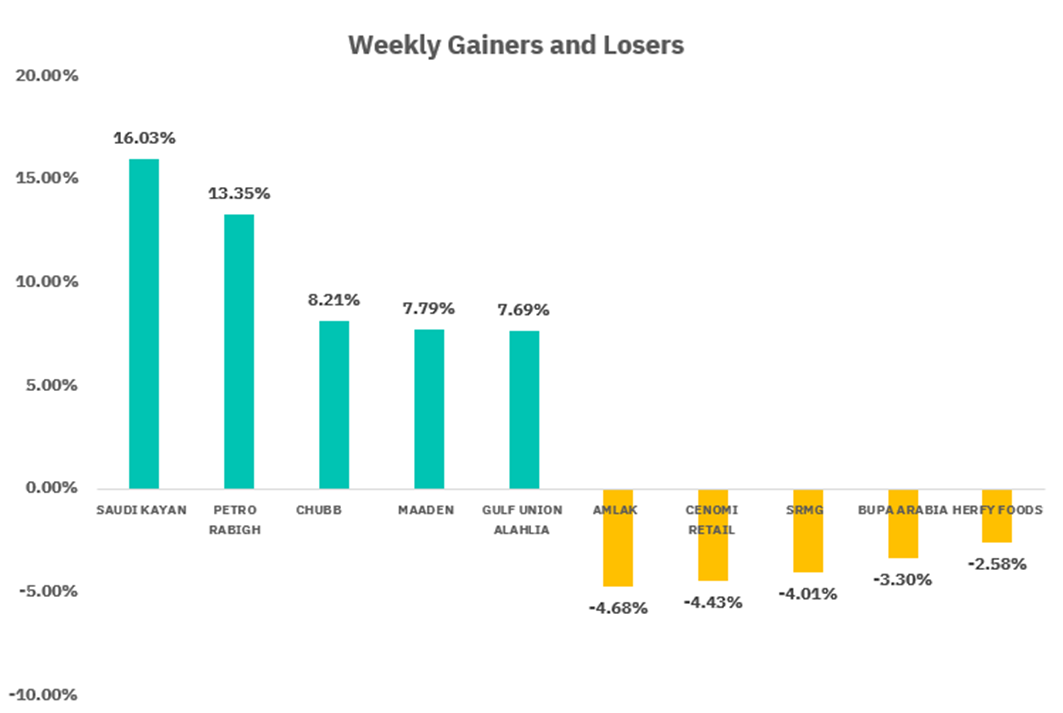
From the perspective of individual stock performance, 209 companies saw their stock prices rise this week, while 61 companies saw their stock prices fall. The companies with the highest increase included SAUDI KAYAN, PETRO RABIGH, CHUBB, with increases of 16.03%, 13.35%, and 8.21% respectively. The companies with the highest decline included AMLAK, CENOMI RETAIL, SRMG with declines of 4.68%, 4.43%, and 4.01% respectively.
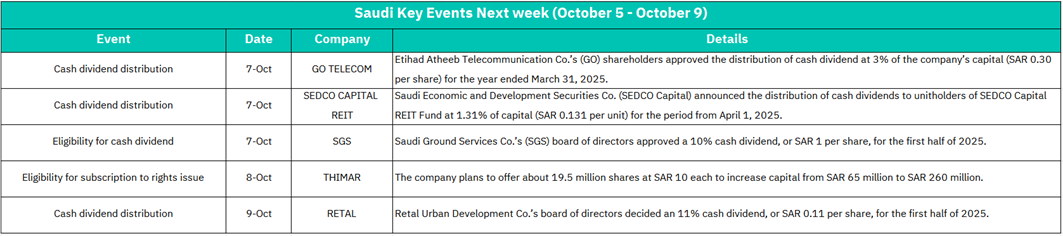
October 7:
GO TELECOM - Etihad Atheeb Telecommunication Co. shareholders approved 3% cash dividend distribution (SAR 0.30 per share) for fiscal year ended March 31, 2025
SEDCO CAPITAL REIT - Saudi Economic and Development Securities Co. announced REIT Fund distribution at 1.31% of capital (SAR 0.131 per unit) for period from April 1, 2025
SGS - Saudi Ground Services Co. board approved 10% cash dividend (SAR 1 per share) for H1 2025
Market Impact:
The triple dividend announcement creates strong positive momentum across telecommunications, REIT, and support services sectors. GO TELECOM's 3% annual dividend signals stability in the telecom sector amid ongoing digital transformation initiatives. The SEDCO CAPITAL REIT distribution is particularly significant as it reinforces investor confidence in Saudi real estate investment trusts, a relatively newer investment vehicle in the Kingdom. SGS's substantial 10% dividend highlights the strength of aviation support services, indirectly reflecting robust travel and tourism activity aligned with Vision 2030 goals.
October 8:
THIMAR - Company plans rights issue offering approximately 19.5 million shares at SAR 10 each to increase capital from SAR 65 million to SAR 260 million
Market Impact: THIMAR's substantial capital increase (4x expansion from SAR 65M to SAR 260M) represents one of the week's most significant corporate actions. This massive rights issue signals aggressive growth plans and confidence in the company's expansion strategy. The SAR 10 per share pricing will need market validation. In the short term, expect potential dilution concerns and technical pressure on THIMAR shares as existing shareholders assess participation.
October 9:
RETAL - Retal Urban Development Co. board decided on 11% cash dividend distribution (SAR 0.11 per share) for H1 2025
Market Impact:
RETAL's 11% dividend distribution closes the week on a positive note for the real estate development sector. Demonstrating consistent dividend policy and strong cash generation. The distribution reinforces the strength of Saudi Arabia's urban development sector.
U.S. Market
S&P500 Technical Analysis:
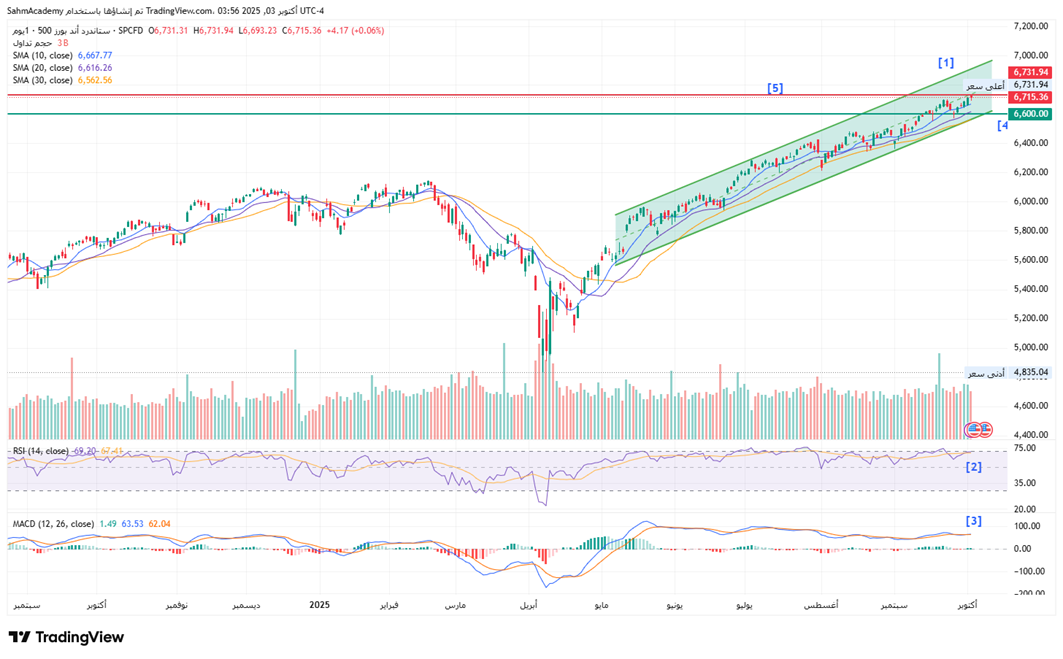
The S&P 500 is currently trading at 6,715.36. The index has demonstrated exceptional strength throughout 2025, [1]maintaining a disciplined uptrend channel with higher highs and higher lows since the May 2024 correction low near 5,100. The moving average configuration remains bullish, with price trading above the SMA 10 (6,667.77), SMA 20 (6,616.26), and SMA 30 (6,562.56), all of which are positively sloped and properly sequenced. The recent price action shows tight consolidation near all-time highs with minimal volatility, suggesting strong institutional accumulation and conviction. Volume patterns have been relatively consistent, though the latest sessions show slightly elevated volume on up days compared to down days, confirming buying pressure remains intact at these elevated levels.
[2] Momentum indicators present a nuanced picture at these record highs. The RSI at 69.20 is approaching overbought territory but has not yet breached the 70 threshold, indicating there remains modest room for further upside before exhaustion signals emerge. Notably, the RSI has maintained a higher low structure throughout the recent rally, confirming underlying strength.
[3] MACD (12, 26) displays a constructive setup, though the histogram shows marginal convergence, suggesting momentum is decelerating even as the trend remains positive.
[4] Key support levels are identified at 6,600, followed by 6,400-6,450 where prior consolidation occurred.
[5] Immediate resistance is the current all-time high at 6,731.
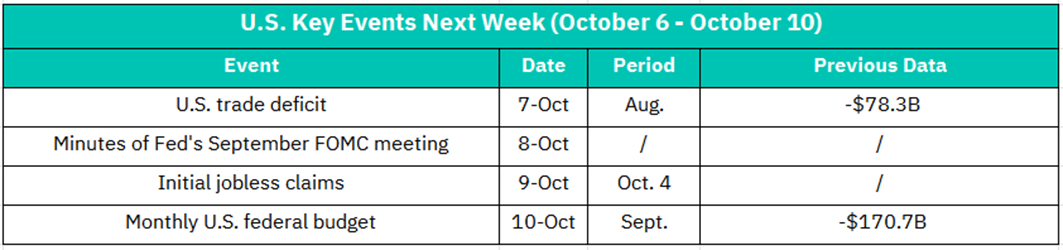
October 7:
U.S. Trade Deficit - August data (Previous: -$78.3B)
Market Impact:
The trade deficit data provides insights into the U.S. economy's external balance and has implications for GDP calculations and currency movements. The previous -$78.3B deficit represents significant import demand over exports. A widening deficit could pressure the dollar and raise concerns about consumption sustainability, while potentially benefiting export-oriented companies. A narrowing deficit might support the dollar but could indicate weakening domestic demand.
Sector Implications:
• Narrowing deficit: Positive for exporters (industrials, agriculture, aerospace), supports dollar, may pressure import-dependent retailers
• Widening deficit: Benefits retailers and consumer discretionary, pressures dollar, negative for domestic manufacturers
• Multinational tech companies: Sensitive to currency movements affecting overseas earnings
The data also feeds into Q3 GDP expectations, making it relevant for broader market positioning ahead of earnings season.
October 8:
FOMC Minutes from September Meeting - Policy statement details and discussion
Market Impact: CRITICAL EVENT - The September FOMC minutes will provide detailed insights into the Fed's policy deliberations, member viewpoints, and economic projections that shaped the recent rate decision. Markets will scrutinize the minutes for:
1. Dot plot details: Individual member rate path expectations and dispersion of views
2. Inflation assessment: How policymakers view current inflation trends and persistence
3. Labor market evaluation: Concerns about weakening vs. confidence in soft landing
4. Future policy guidance: Clues about December meeting and 2026 rate trajectory
5. Dissent analysis: Any disagreements revealing policy uncertainty
October 9:
Initial Jobless Claims
Market Impact:
Weekly jobless claims continue to provide the most timely labor market pulse. Following the previous week's comprehensive employment report, this data will confirm whether labor market trends are accelerating, stabilizing, or deteriorating.
Key Thresholds:
• Below 220K: Indicates labor market resilience, could reinforce hawkish Fed expectations
• 220K-240K: Suggests stable conditions, neutral market impact
• Above 240K: Signals potential weakening, supports dovish Fed positioning
October 10:
Monthly U.S. Federal Budget - September data (Previous: -$170.7B deficit)
Market Impact:
The September federal budget statement provides fiscal policy insights and year-end fiscal position assessment as the government's fiscal year typically ends September 30. The previous -$170.7B monthly deficit reflects ongoing government spending programs and tax receipts.
Crypto ETF Technical Analysis:
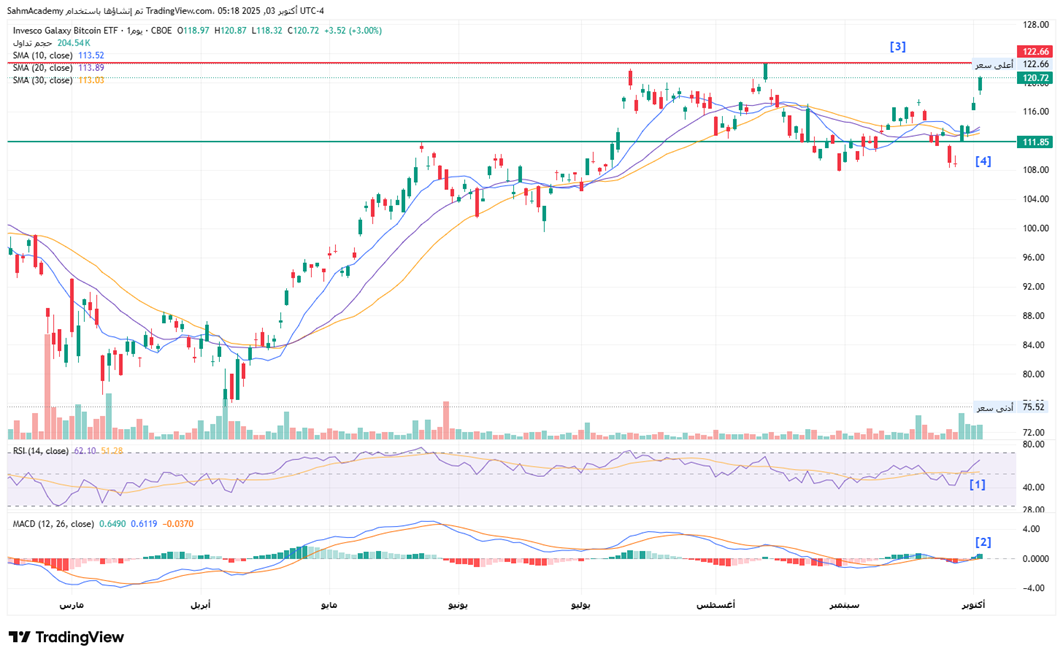
The Invesco Galaxy Bitcoin ETF is currently trading at $120.72, demonstrating a strong bullish breakout after an extended consolidation phase. The moving average structure has recently turned constructive, with price reclaiming the SMA 10 ($113.52), SMA 20 ($113.89), and SMA 30 ($113.03), all of which are now beginning to flatten and curl upward, suggesting the downtrend that persisted from June through September may be exhausting.
[1] RSI at 62.10 has recovered from oversold conditions seen in September and is now positioned in bullish territory without being overbought, indicating there is substantial room for further upside before exhaustion signals emerge.
[2] MACD (12, 26) has generated a bullish crossover, suggesting momentum is shifting positive. This represents a classic early-stage bullish setup.
[3] Key resistance levels are identified at $122.66 (recent high).
[4] Support has been established at $111.85.
The technical outlook has improved significantly, with this breakout suggesting a potential move toward the $125-$130 range if the $122.66 level can be decisively cleared on sustained volume. However, traders should monitor Bitcoin's underlying price action closely, as any weakness in the cryptocurrency market could quickly reverse these gains given the ETF's high correlation to spot Bitcoin prices.
Disclaimer:
Sahm is subject to the supervision and control of the CMA, pursuant to its license no. 22251-25 issued by CMA.
The Information presented above is for information purposes only, which shall not be intended as and does not constitute an offer to sell or solicitation for an offer to buy any securities or financial instrument or any advice or recommendation with respect to such securities or other financial instruments or investments. When making a decision about your investments, you should seek the advice of a professional financial adviser and carefully consider whether such investments are suitable for you in light of your own experience, financial position and investment objectives. The firm and its analysts do not have any material interests or conflicts of interest in any companies mentioned in this report.
Performance data provided is accurate and sourced from reliable platforms, including Argaam, TradingView, MarketWatch.
IN NO EVENT SHALL SAHM CAPITAL FINANCIAL COMPANY BE LIABLE FOR ANY DAMAGES, LOSSES OR LIABILITIES INCLUDING WITHOUT LIMITATION, DIRECT OR INDIRECT, SPECIAL, INCIDENTAL, CONSEQUENTIAL DAMAGES, LOSSES OR LIABILITIES, IN CONNECTION WITH YOUR RELIANCE ON OR USE OR INABILITY TO USE THE INFORMATION PRESENTED ABOVE, EVEN IF YOU ADVISE US OF THE POSSIBILITY OF SUCH DAMAGES, LOSSES OR EXPENSES.
