
We Value Your Feedback! Help us shape better content and experiences by participating in our survey. Join the Survey Now!
Saudi Market
TASI Technical Analysis:
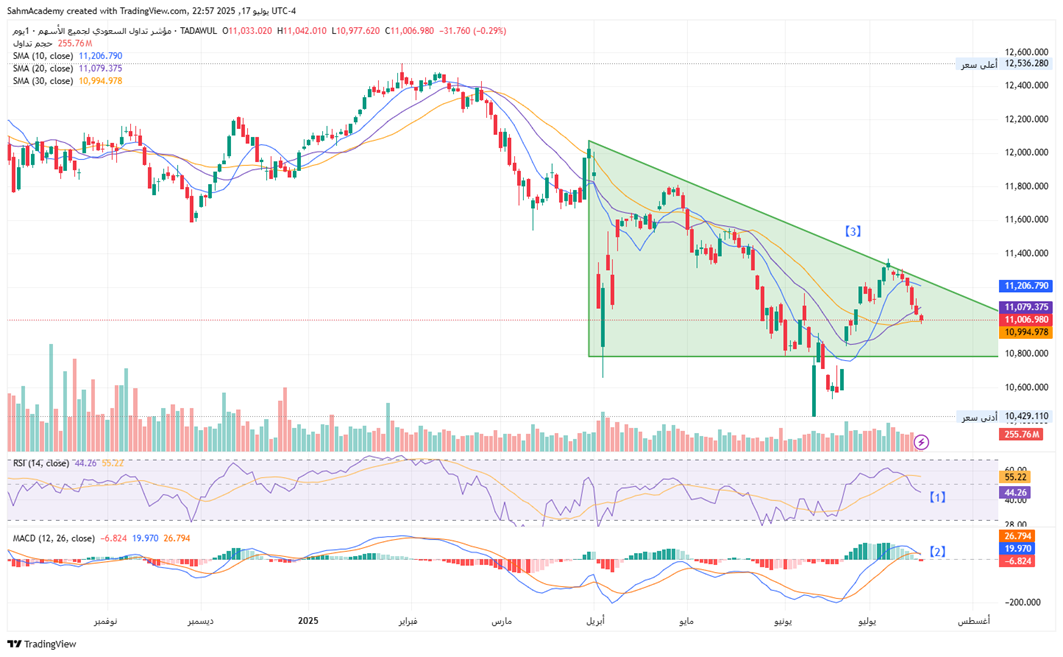
The TADAWUL All Share Index is currently trapped in a confirmed downtrend with the index trading below all major moving averages in bearish alignment. The current price of 11,006.980 sits precariously near the SMA 30 (11,010.605), while facing immediate resistance at the SMA 20 (11,113.543) and SMA 10 (11,211.752).
[1] Technical indicators reinforce the bearish sentiment with RSI at 43.41 indicating underlying weakness.
[2] MACD showing negative momentum with an expanding bearish histogram at 31.366.
[3] The current descending triangle formation suggest further downside potential toward the 10,600-10,800 zone.
Volume analysis reveals a concerning distribution pattern with higher volume during sell-offs and lacklustre buying interest on rallies, confirming institutional distribution. For any meaningful reversal, the index must reclaim the 11,200-11,400 resistance zone with strong volume confirmation and achieve RSI above 50 with a positive MACD crossover. Until these conditions are met, the risk rating remains high with strong bearish trend confidence, suggesting a 3-6 month timeframe for any sustainable trend reversal.
TASI Index Weekly Market Summary (July 13 to July 17)
The TASI index increased by 2.19%. With a trading week of 5 days, the total trading volume reached 21 billion Saudi Riyals, averaging 4.2 billion per day.
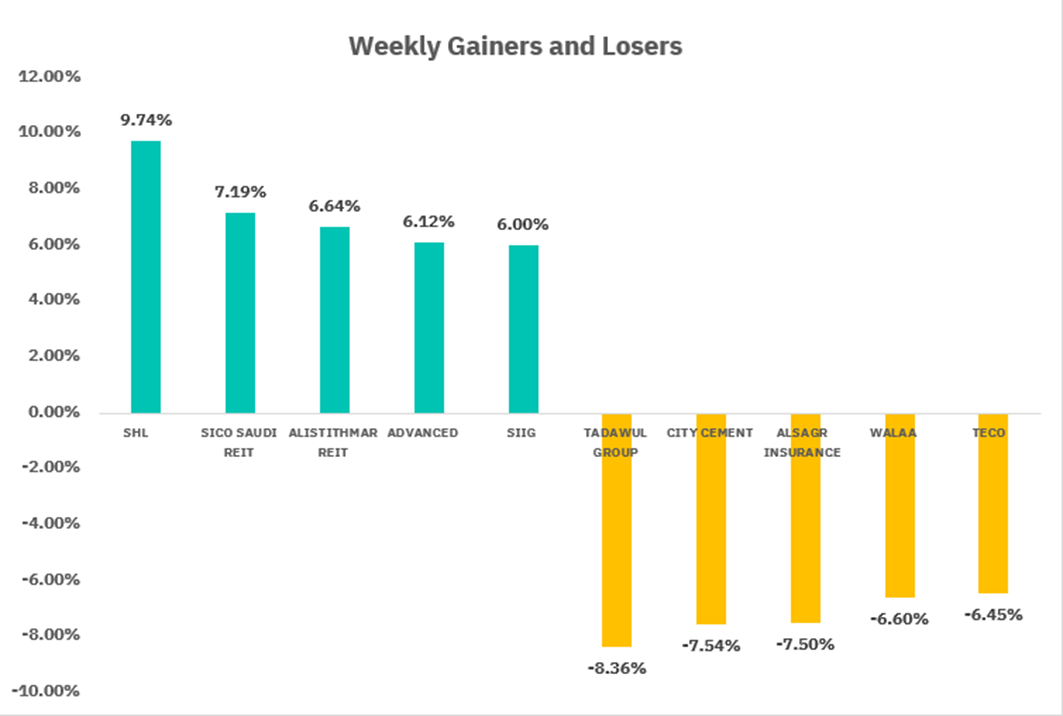
From the perspective of individual stock performance, 44 companies saw their stock prices rise this week, while 226 companies saw their stock prices fall. The companies with the highest increase included SHL, SICO SAUDI REIT, ALISTITHMAR REIT, with increases of 9.74%, 7.19%, and 6.64% respectively. The companies with the highest decline included TADAWUL GROUP, CITY CEMENT, ALSAGR INSURANCE with declines of 8.36%, 7.54%, and 7.50% respectively.
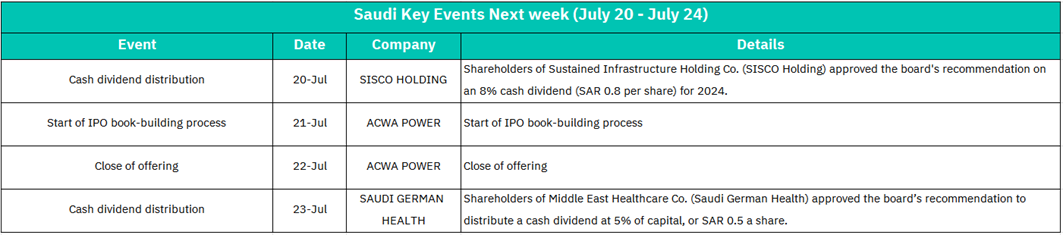
July 20:
SISCO HOLDING
Cash dividend distribution (8% / SAR 0.8 per share).
Reinforces investor confidence in financial stability; attractive for dividend-focused portfolios. Potential positive sentiment for industrial/infrastructure stocks with strong dividend histories.
July 21-22:
ACWA POWER
July 21: Start of IPO book-building
July 22: Close of offering
High institutional demand during book-building → signals strong valuation confidence.
Oversubscription likely → bullish sentiment for debut pricing.
Temporary capital shift from secondary market to IPO subscriptions.
Could boost utilities/renewable energy stocks (e.g., SEC, BEEAH).
Strong demand → positive spillover for upcoming Saudi IPOs
July 23:
SAUDI GERMAN HEALTH
Dividend distribution (5% / SAR 0.5 per share).
May strengthen healthcare peers sector appeal (e.g., Dallah, Al Nahdi).
U.S. Market
S&P500 Technical Analysis:
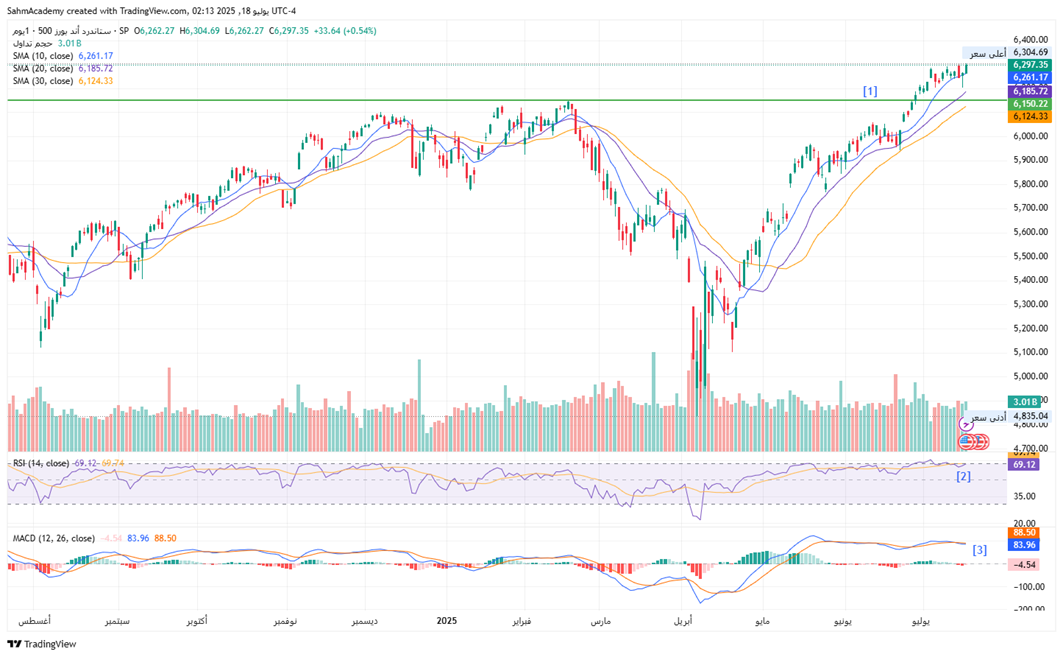
The S&P 500 Index is exhibiting strong bullish momentum following a V-shaped recovery from the April 2025 correction, with the index trading at fresh all-time highs near 6,304.69. The current price structure shows a powerful uptrend supported by all major moving averages in perfect bullish alignment: SMA 10 (6,261.17), SMA 20 (6,185.72), and SMA 30 (6,124.33).
[1] The index has successfully broken above the previous resistance zone around 6,150, which now serves as strong support.
[2] Technical indicators are predominantly bullish with RSI at 69.12 approaching overbought territory but maintaining healthy momentum.
[3] MACD shows positive momentum with the histogram at 83.96, confirming the strength of the current uptrend that began in early May 2025.
The current momentum structure suggests this bull run has further room to extend, particularly if the index can maintain above 6,250 on any pullbacks.
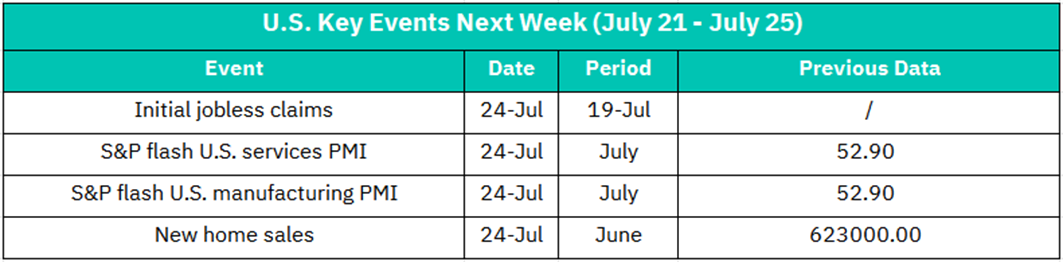
July 24:
Initial Jobless Claims (Week Ending July 19)
> Expectations (Rising claims): Could signal labor market weakness → Boost for bonds/gold, pressure on cyclical stocks (industrials, consumer discretionary).
< Expectations (Falling claims): Reinforces labor resilience → Support for USD and rate-sensitive sectors (financials, tech).
S&P Flash U.S. Services PMI (July)
Previous: 52.9 (Expansion >50)
>52.9: Confirms economic strength → Bullish for consumer stocks, banks.
<52.9 (Especially <50): Signals service-sector contraction → Sell-off in travel/leisure stocks and broader market.
S&P Flash U.S. Manufacturing PMI (July)
Previous: 52.9
>52.9: Supports "soft landing" narrative → Lift for industrial stocks, semiconductors (SOXX).
<52.9: Fuels recession fears → Risk-off shift to defensives (utilities, healthcare).
New Home Sales (June)
Previous: 623,000
>623k: Indicates housing demand resilience → Outperformance in homebuilders (LEN, DHI), construction materials (MLM).
<623k: Suggests high rates biting → Negative for mortgage lenders (RKT), home retailers (HD).
Crypto ETF Technical Analysis:
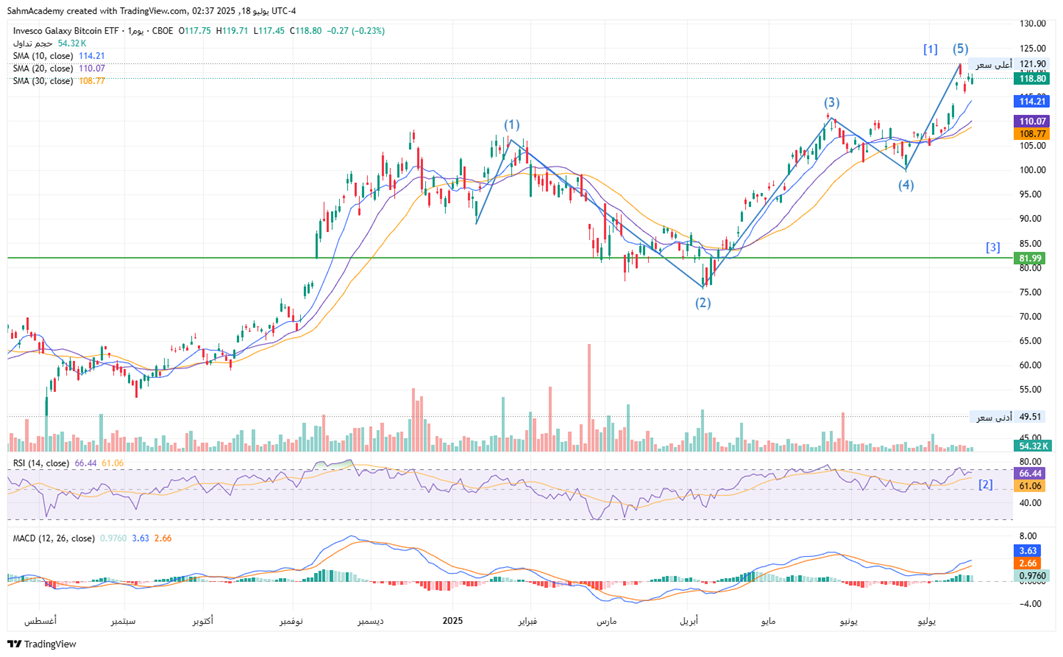
The Invesco Galaxy Bitcoin ETF is demonstrating strong bullish momentum following a successful breakout from a major ascending triangle pattern that formed between April and June 2025. The ETF has decisively broken above the critical resistance zone around $105-110 and is currently trading above all major moving averages in perfect bullish alignment: SMA 10 ($114.21), SMA 20 ($110.07), and SMA 30 ($108.77).
[1] The current price action shows characteristics of a Wave 5 Elliott Wave impulse structure, suggesting the cryptocurrency sector is in the final phase of a major uptrend cycle.
[2] Technical indicators reflect this bullish bias with RSI at 66.44 showing healthy momentum without being overbought.
[3] The Elliott Wave count suggests this is a Wave 5 extension, which typically exhibits strong momentum but also carries higher volatility risks. A sustained break below $100 would invalidate the bullish thesis and potentially target the $85-90 support zone.
While the structure favors continuation, near-term caution is warranted at resistance with RSI approaching overbought levels.
The overall cryptocurrency market structure and Bitcoin's institutional adoption trends support a bullish potential extension toward $140-150 over the next 3-6 months, contingent on broader crypto market conditions and regulatory developments.
Disclaimer:
Sahm is subject to the supervision and control of the CMA, pursuant to its license no. 22251-25 issued by CMA.
The Information presented above is for information purposes only, which shall not be intended as and does not constitute an offer to sell or solicitation for an offer to buy any securities or financial instrument or any advice or recommendation with respect to such securities or other financial instruments or investments. When making a decision about your investments, you should seek the advice of a professional financial adviser and carefully consider whether such investments are suitable for you in light of your own experience, financial position and investment objectives. The firm and its analysts do not have any material interests or conflicts of interest in any companies mentioned in this report.
Performance data provided is accurate and sourced from reliable platforms, including Argaam, TradingView, MarketWatch.
IN NO EVENT SHALL SAHM CAPITAL FINANCIAL COMPANY BE LIABLE FOR ANY DAMAGES, LOSSES OR LIABILITIES INCLUDING WITHOUT LIMITATION, DIRECT OR INDIRECT, SPECIAL, INCIDENTAL, CONSEQUENTIAL DAMAGES, LOSSES OR LIABILITIES, IN CONNECTION WITH YOUR RELIANCE ON OR USE OR INABILITY TO USE THE INFORMATION PRESENTED ABOVE, EVEN IF YOU ADVISE US OF THE POSSIBILITY OF SUCH DAMAGES, LOSSES OR EXPENSES.
