We Value Your Feedback! Help us shape better content and experiences by participating in our survey. Join the Survey Now!
Saudi Market
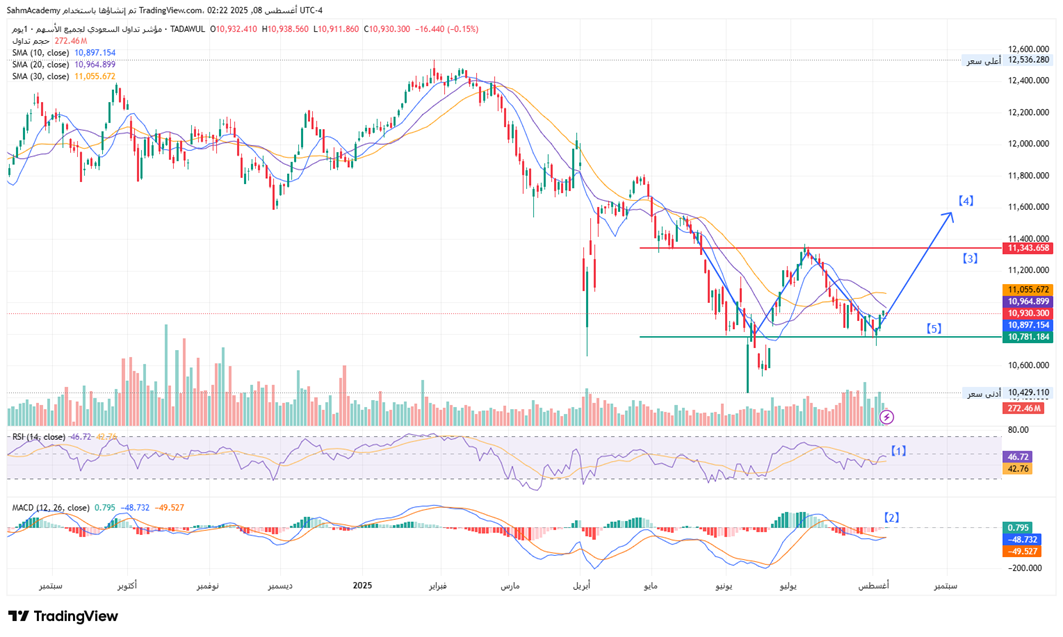
TASI Technical Analysis:
The TASI is showing early signs of a potential trend reversal at 10,930.30, having successfully defended the critical July 2025 lows around 10,429-10,500. The index is now trading above its 10-day SMA (10,897.15) for the first time in months
[1] The RSI at 46.72 displays positive divergence suggesting oversold conditions may be resolving.
[2] The MACD remains deeply negative (-49.53) but shows signs of bottoming, and the convergence of moving averages indicates a potential base formation. Volume patterns suggest institutional accumulation rather than panic selling, supporting the double bottom thesis with the July lows.
[3] The technical setup has shifted from bearish to neutral-bullish, with key resistance at 11,343 .
[4] A sustained break above 11,343 with volume completing the potential double bottom pattern.
[5] Critical support remains at 10,781.
TASI Index Weekly Market Summary (August 3 to August 7)
The TASI index decreased by 0.9%. With a trading week of 5 days, the total trading volume reached 23 billion Saudi Riyals, averaging 4.6 billion per day.
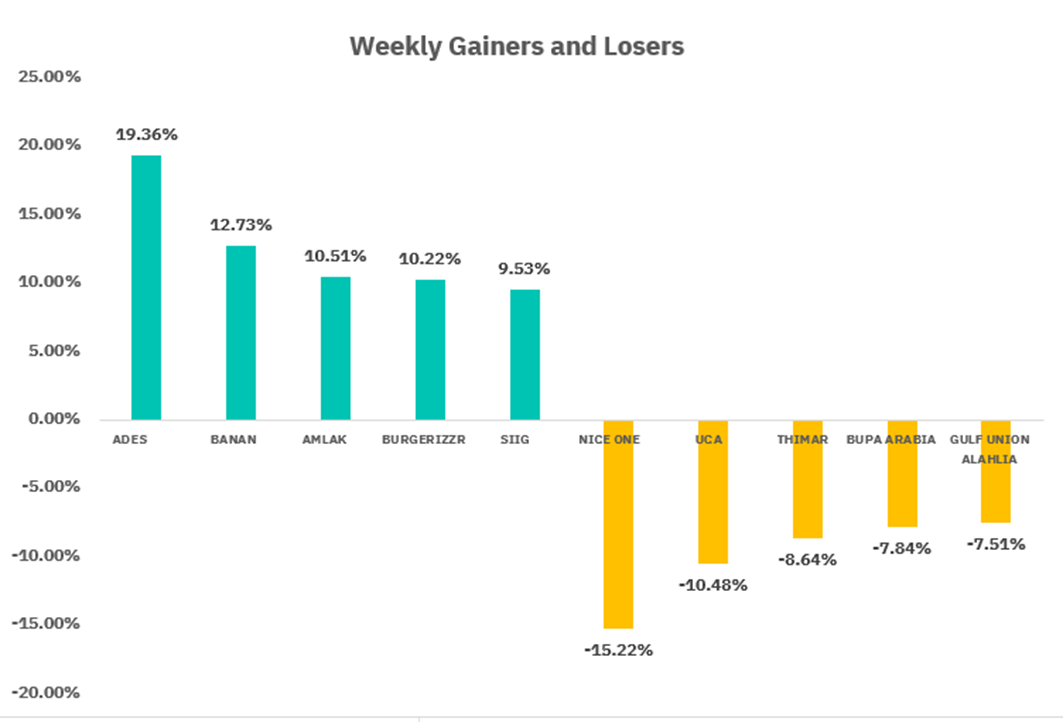
From the perspective of individual stock performance, 195 companies saw their stock prices rise this week, while 78 companies saw their stock prices fall. The companies with the highest increase included ADES, BANAN, AMLAK, with increases of 19.36%, 12.73%, and 10.51% respectively. The companies with the highest decline included NICE ONE, UCA, THIMAR with declines of 15.22%, 10.48%, and 8.64% respectively.
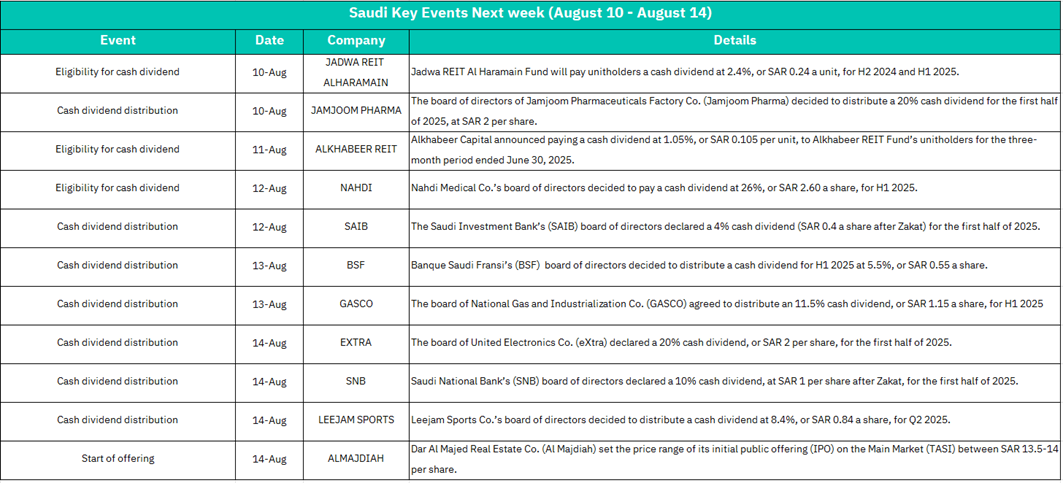
August 10 :
JADWA REIT ALHARAMAIN - Cash dividend eligibility (2.4% yield, SAR 0.24/unit)
JAMJOOM PHARMA - Cash dividend distribution (20% dividend, SAR 2/share)
Moderate positive sentiment for REIT and pharmaceutical sectors. JADWA REIT's competitive yield may attract income-focused investors, while JAMJOOM PHARMA's substantial 20% dividend signals strong cash flow management.
August 11:
ALKHABEER REIT - Cash dividend eligibility (1.05% yield, SAR 0.105/unit)
Limited impact. Lower yield compared to JADWA REIT may create relative underperformance pressure within the REIT sector.
August 12:
NAHDI - Cash dividend eligibility (26% dividend, SAR 2.60/share)
SAIB - Cash dividend distribution (4% dividend, SAR 0.4/share post-Zakat)
Strong positive momentum expected. NAHDI's exceptional 26% dividend yield will likely drive significant investor interest in healthcare stocks. SAIB's 4% banking dividend reinforces sector stability.
August 13:
BSF (Banque Saudi Fransi) - Cash dividend distribution (5.5% yield, SAR 0.55/share)
GASCO - Cash dividend distribution (11.5% dividend, SAR 1.15/share)ANB (bank) and Derayah (finance) shares dip technically post-payout.
Highly positive for energy and banking sectors. GASCO's double-digit dividend yield reflects strong energy sector fundamentals, while BSF's solid banking dividend supports financial sector confidence.
August 14
EXTRA - Cash dividend distribution (20% dividend, SAR 2/share)
SNB (Saudi National Bank) - Cash dividend distribution (10% dividend, SAR 1/share post-Zakat)
LEEJAM SPORTS - Cash dividend distribution (8.4% yield, SAR 0.84/share)
ALMAJDIAH - IPO pricing announcement (SAR 13.5-14/share range)
Peak activity day with maximum market influence. Multiple high-yield distributions across retail, banking, and sports sectors will boost overall market liquidity. ALMAJDIAH's IPO adds new investment opportunity in real estate sector.
U.S. Market
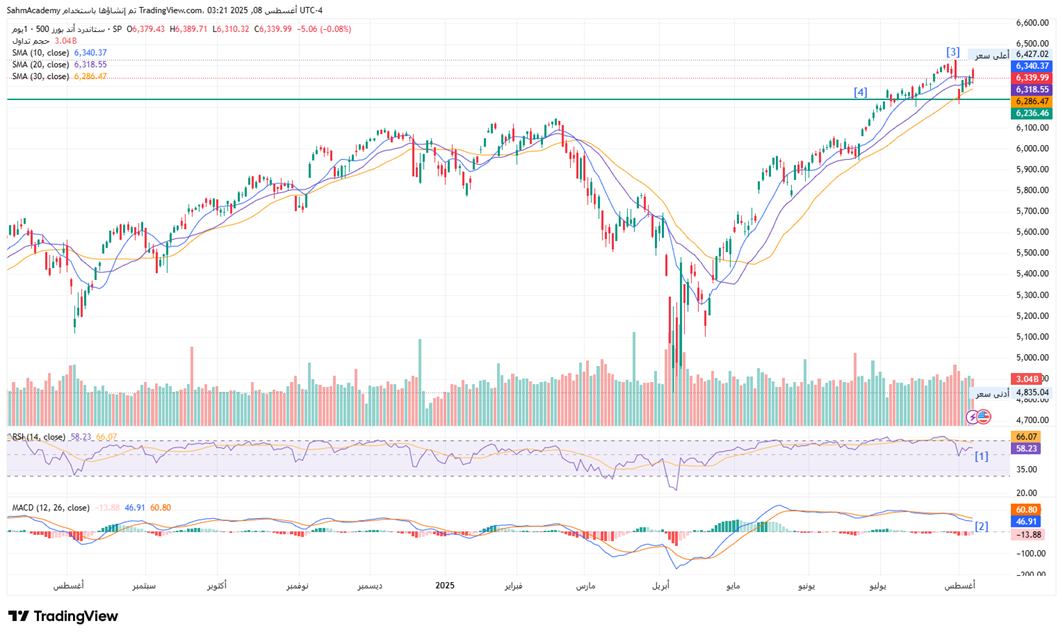
S&P500 Technical Analysis:
The S&P 500 is exhibiting classic bull market behavior at 6,339.99, trading just 1.4% below its all-time high of 6,427.02 with exceptional technical strength intact. The index demonstrates perfect moving average alignment (SMA 10: 6,340.37, SMA 20: 6,318.55, SMA 30: 6,286.47) with all key levels providing ascending support.
[1] The RSI at 58.23 shows healthy momentum without overbought conditions
[2] The MACD histogram at 60.80 confirms sustained bullish momentum.
[3] The technical structure strongly favors continued upside with immediate resistance at 6,427 (recent highs).
[4] Key support remains robust at 6,236 with any dip to this level presenting attractive entry opportunities.
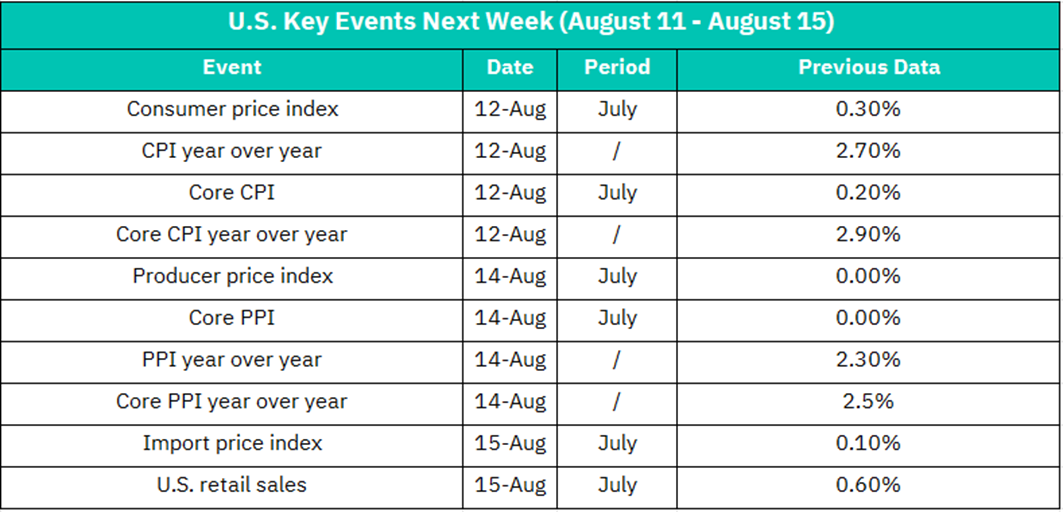
August 12:
Consumer Price Index (CPI) - July data
Previous: +0.30% MoM
Previous YoY: +2.70%
Core CPI - July data
Previous: +0.20% MoM
Previous YoY: +2.90%
Market Impact: HIGH SIGNIFICANCE
• Primary focus for Federal Reserve monetary policy decisions
• Core CPI above Fed's 2% target suggests persistent inflationary pressures
• Any acceleration could reduce probability of Fed rate cuts
• Sectors at risk: Interest-sensitive stocks (REITs, utilities, high-dividend equities)
• Potential beneficiaries: Financials if rates remain elevated, energy if inflation driven by commodity prices
August 14:
Producer Price Index (PPI) - July data
Previous: 0.00% MoM
Previous YoY: +2.30%
Core PPI - July data
Previous: 0.00% MoM
Previous YoY: +2.50%
Market Impact: MODERATE TO HIGH SIGNIFICANCE
• Leading indicator for future consumer inflation trends
• Flat previous readings suggest cooling pipeline pressures
• Any uptick could signal renewed inflationary momentum
• Manufacturing & Industrial stocks particularly sensitive to PPI changes
• Supply chain and commodity-related equities will react strongly
August 15:
Import Price Index - July data
Previous: +0.10% MoM
U.S. Retail Sales - July data
Previous: +0.60% MoM
Market Impact: HIGH SIGNIFICANCE
• Retail Sales = critical consumer spending indicator (~70% of GDP)
• Previous +0.60% shows robust consumer demand
• Import Prices affect inflation through goods costs
• Consumer discretionary stocks highly sensitive to retail sales data
• Dollar strength/weakness will be influenced by import price trends
Crypto ETF Technical Analysis:
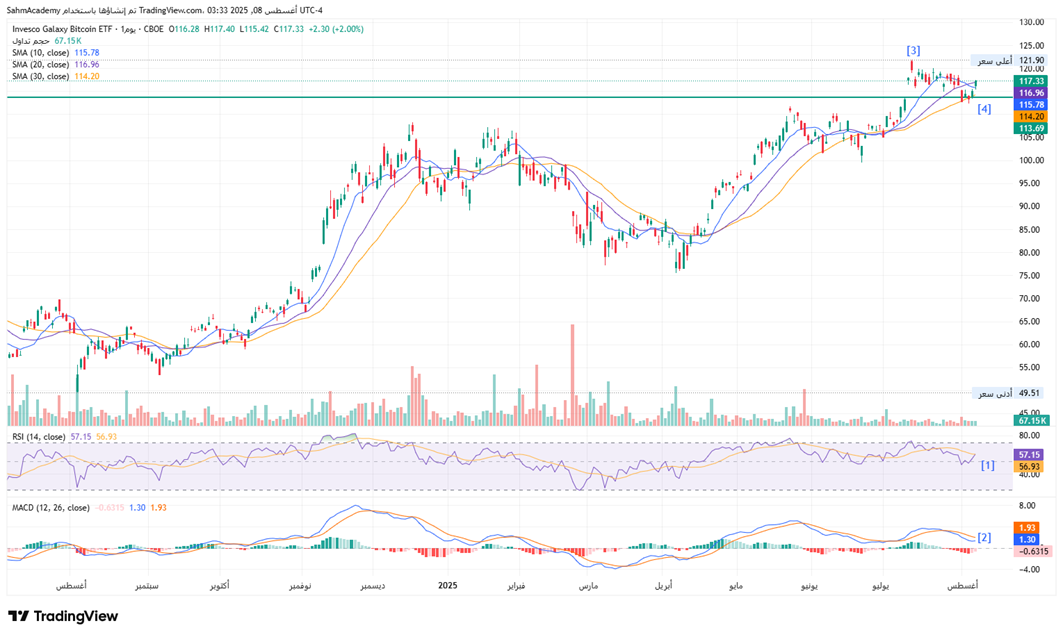
The Invesco Galaxy Bitcoin ETF is demonstrating exceptional institutional momentum at $117.33. The ETF exhibits perfect moving average alignment (SMA 10: $115.78, SMA 20: $116.96, SMA 30: $114.20) with price consolidating just 3.7% below its all-time high of $121.90.
[1] The RSI at 57.15 shows healthy momentum with room for extension.
[2] The MACD histogram at 1.93 confirms bullish momentum expansion.
[3] The technical structure strongly favors continued upside with immediate resistance at $121.9 (all-time high).
[4] Critical support remains robust at $113.69, providing an excellent risk/reward entry point for new positions.
Disclaimer:
Sahm is subject to the supervision and control of the CMA, pursuant to its license no. 22251-25 issued by CMA.
The Information presented above is for information purposes only, which shall not be intended as and does not constitute an offer to sell or solicitation for an offer to buy any securities or financial instrument or any advice or recommendation with respect to such securities or other financial instruments or investments. When making a decision about your investments, you should seek the advice of a professional financial adviser and carefully consider whether such investments are suitable for you in light of your own experience, financial position and investment objectives. The firm and its analysts do not have any material interests or conflicts of interest in any companies mentioned in this report.
Performance data provided is accurate and sourced from reliable platforms, including Argaam, TradingView, MarketWatch.
IN NO EVENT SHALL SAHM CAPITAL FINANCIAL COMPANY BE LIABLE FOR ANY DAMAGES, LOSSES OR LIABILITIES INCLUDING WITHOUT LIMITATION, DIRECT OR INDIRECT, SPECIAL, INCIDENTAL, CONSEQUENTIAL DAMAGES, LOSSES OR LIABILITIES, IN CONNECTION WITH YOUR RELIANCE ON OR USE OR INABILITY TO USE THE INFORMATION PRESENTED ABOVE, EVEN IF YOU ADVISE US OF THE POSSIBILITY OF SUCH DAMAGES, LOSSES OR EXPENSES.