
We Value Your Feedback! Help us shape better content and experiences by participating in our survey. Join the Survey Now!
Saudi Market

TASI Technical Analysis:
The Tadawul All Shares Index (TASI) currently trades at 11,485.050, displaying a bearish market structure with lower highs and lower lows since the February peak at approximately 12,536.
The price is marginally above the 10-day SMA (11,441.589), below the 20-day SMA (11,556.267) and 30-day SMA (11,509.753), forming a bearish alignment (10 < 30 < 20) and indicating downward pressure. It is sandwiched between the 10-day SMA (support) and the 30-day SMA (resistance), establishing a key decision zone for near-term direction.
Significant volume spikes occurred during the April capitulation selloff, indicating potential selling exhaustion. However, subsequent recovery attempts have occurred on diminishing volume, suggesting limited conviction in the rebound efforts
The 14-day RSI reading of 45.83 sits in neutral territory, slightly below the 50 midline, indicating a slight bearish bias but not oversold conditions. The lack of positive divergence on recent lows suggests the downtrend may not be exhausted.
MACD (6.298, -56.915, -63.213) shows mixed signals with the MACD line above the signal line (a short-term positive) but both lines remaining below the zero line (a medium-term negative). The histogram has turned positive but remains shallow, indicating weak upward momentum that has yet to overcome the broader bearish bias.
Key technical patterns include a descending channel since February, lower highs and lower lows since the February peak, confirming the downtrend, and a death cross in March when the 10-day SMA crossed below the 20-day SMA.
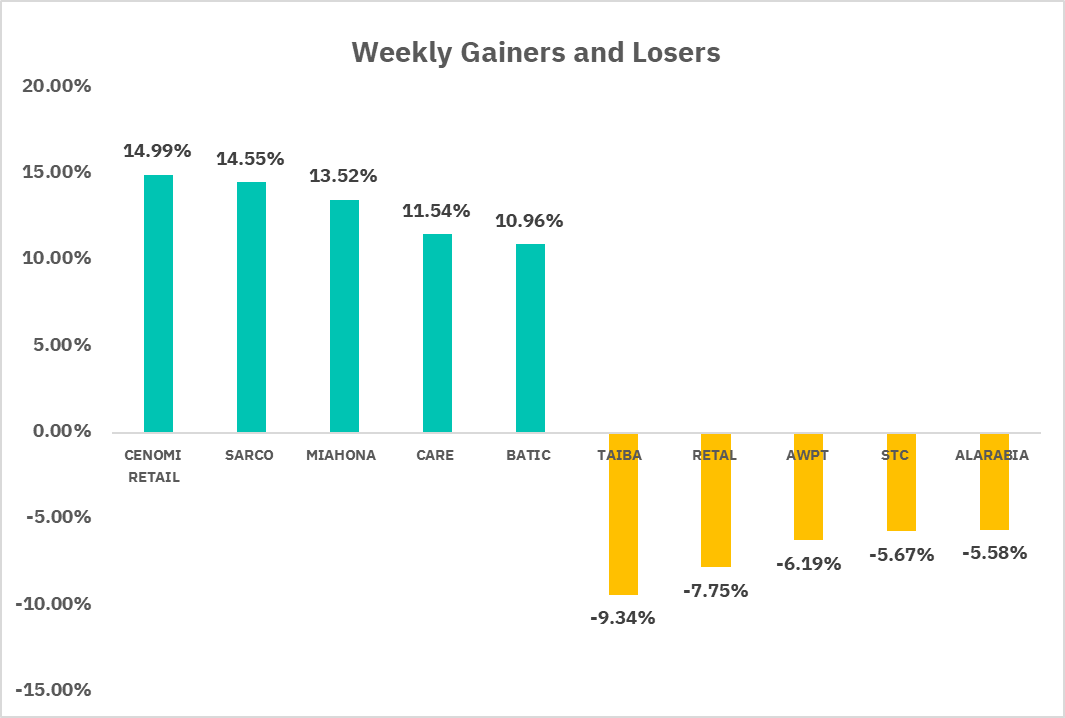
TASI Index Weekly Market Summary (May 11 to May 15)
The TASI index increased by 1.22%. With a trading week of 5 days, the total trading volume reached 26 billion Saudi Riyals, averaging 5.2 billion per day.
From the perspective of individual stock performance, 172 companies saw their stock prices rise this week, while 90 companies saw their stock prices fall. The companies with the highest increase included CENOMI RETAIL, SARCO, MIAHONA, with increases of 14.99%, 14.55%, and 13.52% respectively. The companies with the highest decline included TAIBA, RETAL, AWPT, with declines of 9.34%, 7.75%, and 6.19% respectively.
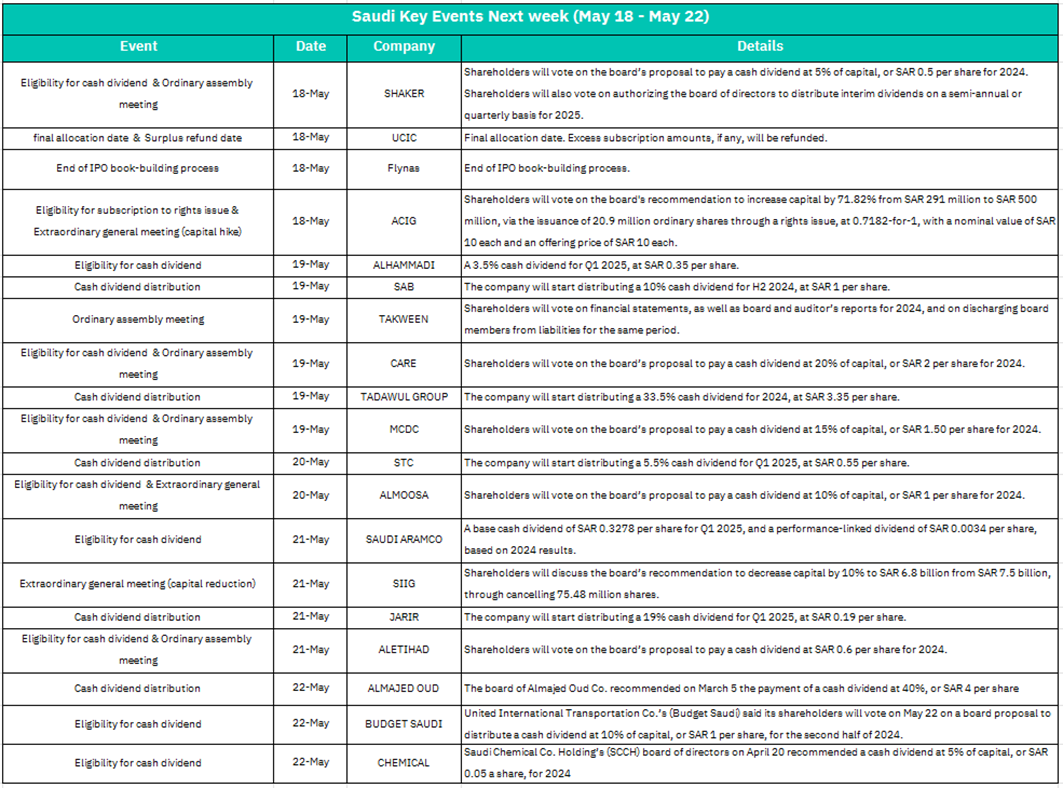
1.May 18 – SHAKER
Shareholders to vote on 5% cash dividend (SAR 0.5/share) for 2024 and authorization for interim dividends in 2025.
Likely positive sentiment due to dividend approval and flexibility for future payouts.
– UCIC
Final allocation and surplus refund for IPO subscribers.
Short-term liquidity adjustments as excess funds return to investors.
– Flynas
End of IPO book-building process.
Potential volatility in aviation/travel sectors depending on subscription demand and pricing.
– ACIG
Vote on 71.82% capital hike (SAR 500M) via rights issue (0.7182-for-1 at SAR 10/share).
Dilution risk may pressure share price short-term, but long-term growth plans could attract investors.
2. May 19 – ALHAMMADI, SAB, CARE, TADAWUL GROUP, MCDC
Multiple cash dividends (3.5%–33.5%) and shareholder meetings.
TADAWUL GROUP’s 33.5% dividend (SAR 3.35/share) stands out, likely boosting investor interest. High dividend yields across companies may drive sector-specific buying activity.
– TAKWEEN
Vote on 2024 financials and board discharge.
Approval could stabilize confidence; rejection may trigger governance concerns.
3. May 20 – STC
5.5% cash dividend (SAR 0.55/share) distribution begins.
Reinforces STC’s reputation as a dividend stalwart, supporting steady demand.
– ALMOOSA
Vote on 10% dividend (SAR 1/share).
Positive sentiment if approved, but minimal market-wide effect due to smaller scale.
4. May 21 – SAUDI ARAMCO
Base dividend (SAR 0.3278/share) + performance-linked dividend (SAR 0.0034/share).
Stable payout maintains Aramco’s appeal to income-focused investors; limited surprise.
– SIIG
Vote on 10% capital reduction (SAR 6.8B from SAR 7.5B).
Could signal financial restructuring, possibly viewed as efficiency-driven (bullish) or distress-driven (bearish).
– JARIR
19% dividend (SAR 0.19/share) distribution begins.
Retail sector may see short-term momentum.
5. May 22 – ALMAJED OUD, BUDGET SAUDI, CHEMICAL
Dividends of 40% (SAR 4/share), 10% (SAR 1/share), and 5% (SAR 0.05/share) proposed.
ALMAJED OUD’s 40% payout is notable, likely driving speculative interest.
U.S. Market

S&P500 Technical Analysis:
The S&P 500 is trading at 5,916.92, having made a remarkable V-shaped recovery from the March-April selloff, reclaiming almost all lost ground. The index shows a strong impulse move higher with minimal retracements, indicating robust institutional buying. The price is significantly above the 10-day SMA (5,743.93), 20-day SMA (5,590.83), and 30-day SMA (5,483.29), which have completed a bullish alignment after the March correction, signaling the resumption of the primary uptrend. Trading volume (3.07B) remains consistent, with notable spikes during the March decline and April reversal, showing strong buying volume during the initial recovery phase. Recent upside movement has occurred on steady volume, typical of continuation phases in established trends. The 14-day RSI reading of 68.17 is approaching but not yet in overbought territory, suggesting momentum remains strong with potential for further near-term upside. MACD (45.68, 100.60, 54.92) shows robust positive momentum with the MACD line above the signal line and the histogram in solidly positive territory, confirming the strong directional momentum. Key technical patterns include a V-bottom recovery, and higher highs and higher lows since April, confirming the resumption of the primary uptrend. Support levels are at 5,743.93 (10-day SMA), and 5,590.83 (20-day SMA).

May 22 – Initial Jobless Claims (Week Ending May 17)
Release of weekly unemployment claims data.
Higher-than-expected claims could signal labor market weakness, weighing on equities (especially cyclical sectors). Lower claims may reinforce confidence in economic resilience.
– S&P Flash U.S. Services PMI (May)
A reading above 50 (expansion) would support optimism for consumer-driven sectors (e.g., retail, hospitality). A contraction (<50) could trigger concerns about slowing demand.
– S&P Flash U.S. Manufacturing PMI (May)
Previous: 50.2 (slight expansion).
A hold above 50 would ease recession fears, benefiting industrials and materials stocks. A drop below 50 might pressure risk sentiment and tech/growth sectors.
– Existing Home Sales (April)
Previous: 4.02 million (annualized).
Stronger sales could lift housing-related stocks (homebuilders, construction materials). Weakness may reflect affordability challenges, dampening real estate and financial sectors.
Crypto ETF Technical Analysis:

The Invesco Galaxy Bitcoin ETF (BTCO) is currently trading at $103.04 and is in a strong uptrend, with the price moving within an ascending channel that has been formed since April, with support at the lower end of the channel at around $99-100. The price is above all key moving averages, forming a bullish alignment (10-day average > 20-day average > 30-day average), which generally indicates a strong uptrend. Volume analysis shows that current volume (97.53K) is at an average level with no significant distribution pattern. Volume has confirmed healthy levels since the April rally, although the recent consolidation phase has been light, which is normal during a consolidation phase. The 14-day relative strength index (RSI) reading of 66.60 suggests that the asset is approaching overbought territory (70+), but is not yet overextended, which means there is still room to move up before a potential pullback. MACD (0.6975, 4.30, 3.60) shows positive momentum, the MACD line is above the signal line, and the histogram is in the positive zone, which confirms the bullish trend shown by the price action. In terms of technical patterns, the rising channel pattern has been clear since the April low, and the current price trend indicates accumulation within the channel. The higher lows established since the March low indicate increased buyer interest. In terms of support and resistance, resistance is at $104.00 (the day's high) and $108.21 (the recent high); support is at $101.19 (the day's low), $99.86 (10-day moving average), and about $96 (20-day moving average).
Disclaimer:
Sahm is subject to the supervision and control of the CMA, pursuant to its license no. 22251-25 issued by CMA.
The Information presented above is for information purposes only, which shall not be intended as and does not constitute an offer to sell or solicitation for an offer to buy any securities or financial instrument or any advice or recommendation with respect to such securities or other financial instruments or investments. When making a decision about your investments, you should seek the advice of a professional financial adviser and carefully consider whether such investments are suitable for you in light of your own experience, financial position and investment objectives. The firm and its analysts do not have any material interests or conflicts of interest in any companies mentioned in this report.
Performance data provided is accurate and sourced from reliable platforms, including Argaam, TradingView, MarketWatch.
IN NO EVENT SHALL SAHM CAPITAL FINANCIAL COMPANY BE LIABLE FOR ANY DAMAGES, LOSSES OR LIABILITIES INCLUDING WITHOUT LIMITATION, DIRECT OR INDIRECT, SPECIAL, INCIDENTAL, CONSEQUENTIAL DAMAGES, LOSSES OR LIABILITIES, IN CONNECTION WITH YOUR RELIANCE ON OR USE OR INABILITY TO USE THE INFORMATION PRESENTED ABOVE, EVEN IF YOU ADVISE US OF THE POSSIBILITY OF SUCH DAMAGES, LOSSES OR EXPENSES.
