We Value Your Feedback! Help us shape better content and experiences by participating in our survey. Join the Survey Now!
Company Overview:
ACWA Power (stock code: 2082.SE), a global renewable energy and desalination infrastructure giant supported by Saudi Arabia's sovereign background, is accelerating the realization of its 2030 asset scale target of US$250 billion through the signing of US$8.3 billion in new projects, 592% oversubscribed equity financing and strategic expansion in three continents. In Q1 2025, the company's net profit surged 44% year-over-year, and its pipeline of projects in hand encompasses 15 GW of wind and solar projects, as well as 400,000 cubic meters/day of green energy desalination, laying the foundation for medium- and long-term growth certainty.
Company Profile and Market Positioning
A global core infrastructure asset operator, its business covers three major sectors: electricity (renewable energy + gas), desalination and green hydrogen:
Installed capacity: total managed assets of US$107 billion, including 78.9 GW of installed power generation capacity (wind and solar account for more than 60%) and 9.5 million cubic meters/day of desalination capacity, making it the world's largest private desalination company (market share exceeds 40%).
Shareholder structure: Saudi Public Investment Fund (PIF) holds 34.9% of the shares through Badeel, Saudi Arabian Electric (SAPCO) holds 30% of the shares, and the state capital holds nearly 65% of the shares, providing strong project resources and credit endorsement.
Geographical distribution: The project covers 14 countries, including Saudi Arabia, the United Arab Emirates, Egypt, Uzbekistan, South Africa, and China, and will accelerate expansion to Southeast Asia (Malaysia), West Africa (Senegal) and China in 2025.
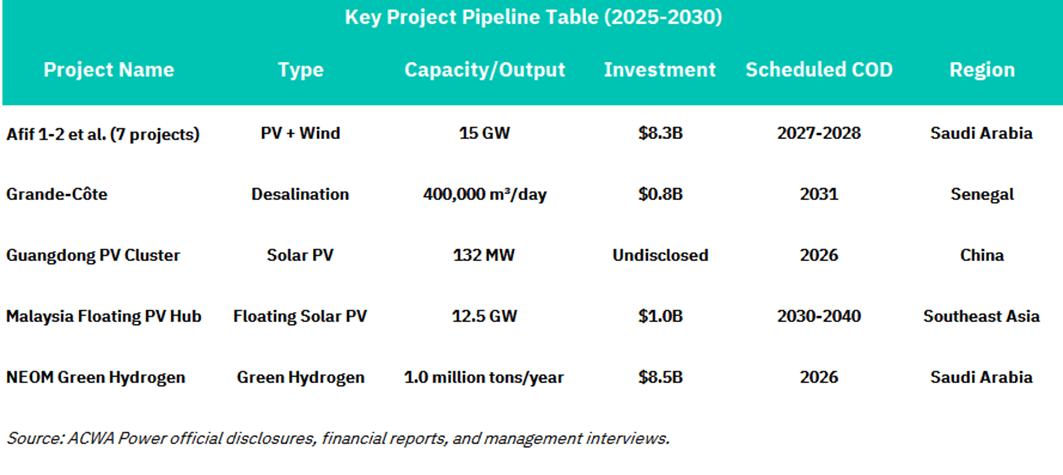
Key Project Pipeline Table (2025-2030)
Growth strategy and project pipeline
(1) Local anchoring Saudi Vision 2030
Signed 15 GW wind and solar projects (12 GW photovoltaic + 3 GW wind power), with a total investment of US$8.3 billion, to be put into operation in 2027-2028. The project adopts a 25-year PPA agreement and is purchased by SPPC (Saudi Arabia's state-owned power purchasing entity), locking in long-term returns.
The Saudi Ministry of Energy aims to install 130 GW of renewable energy by 2030. ACWA, as the largest executor, is expected to obtain more than 50% of the share.
(2) Global expansion: Focus on infrastructure gaps in emerging markets
China: Established Shanghai Global Innovation Center, planned to invest US$30-75 billion by 2030. A 1 GW project has been launched (132 MW photovoltaic + 200 MW wind power in Guangdong), cooperating with Chinese companies such as Sungrow Power Supply and Mingyang Smart Energy.
Southeast Asia: Malaysia has agreed to invest US$1 billion to develop a 12.5 GW floating photovoltaic and seawater desalination project.
Africa: Senegal's $800 million desalination project (400,000 cubic meters/day), 100% green electricity-driven, is the largest single project in West Africa.
(3) Green hydrogen first-mover advantage
Saudi Arabia's NEOM base is building the world's largest 2.2 GW water electrolysis hydrogen production plant (80% progress), which will be put into operation in 2026, with an annual production capacity of 1 million tons, mainly for export.
Valuation:
Income statement analysis
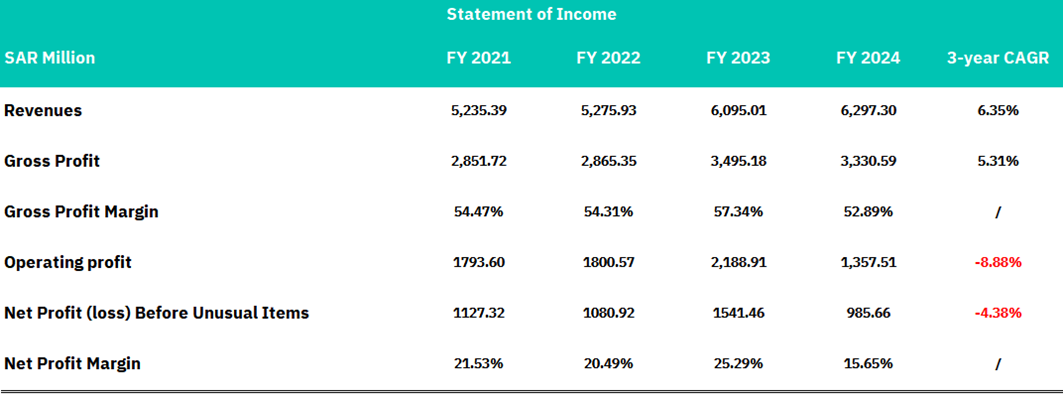
ACWA Power has demonstrated solid top-line growth with revenues expanding at a 6.35% compound annual growth rate from SAR 5,235.39 million in 2021 to SAR 6,297.30 million in 2024. Gross profit has grown at a healthy 5.31% CAGR, reaching SAR 3,330.59 million in 2024, while maintaining consistently strong gross margins above 50% throughout the period. The company achieved peak gross margin performance of 57.34% in 2023, indicating effective cost management and pricing power in its renewable energy and infrastructure markets. This sustained gross profitability demonstrates ACWA Power's competitive positioning and operational efficiency in executing large-scale energy projects.
However, the company's operating and net profit performance reveals concerning trends that warrant investor attention. Operating profit declined sharply with a negative 8.88% CAGR, falling from SAR 1,793.60 million in 2021 to SAR 1,357.51 million in 2024, despite the revenue growth. This deterioration reflects significant operating expense inflation that has outpaced revenue growth, particularly evident in the dramatic drop from SAR 2,188.91 million operating profit in 2023 to SAR 1,357.51 million in 2024. Similarly, net profit before unusual items contracted at a negative 4.38% CAGR, with net profit margins compressing from 21.53% in 2021 to 15.65% in 2024. While ACWA Power maintains a solid market position with consistent revenue growth and strong gross margins, the deteriorating operational leverage and margin compression suggest management needs to address cost structure efficiency to restore earnings momentum and maximize shareholder value creation.
Balance sheet analysis
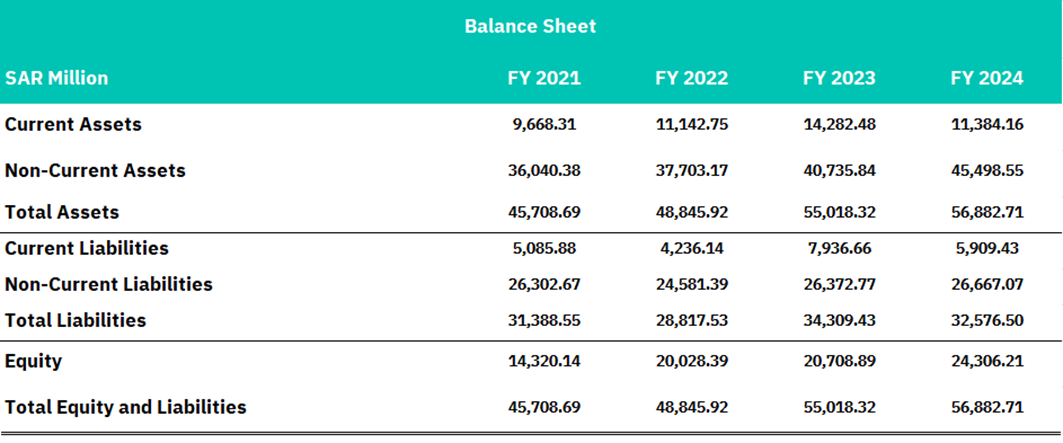
ACWA Power has demonstrated substantial balance sheet expansion and strategic capital deployment over the 2021-2024 period, with total assets growing from SAR 45,708.69 million to SAR 56,882.71 million, representing a 24.4% increase. The company's asset base is heavily weighted toward non-current assets, which expanded from SAR 36,040.38 million to SAR 45,498.55 million, reflecting significant investments in long-term infrastructure projects and power generation facilities that are characteristic of the renewable energy sector. Current assets showed volatility, peaking at SAR 14,282.48 million in 2023 before declining to SAR 11,384.16 million in 2024, which may indicate the completion of major project milestones or strategic working capital optimization as projects transition from development to operational phases.
The company's capital structure reveals disciplined financial management with a strengthening equity position that grew from SAR 14,320.14 million in 2021 to SAR 24,306.21 million in 2024, representing a 69.7% increase and improved capitalization. Total liabilities increased modestly from SAR 31,388.55 million to SAR 32,576.50 million, indicating controlled debt growth relative to asset expansion. The debt-to-equity ratio improved significantly from 2.19x in 2021 to 1.34x in 2024, demonstrating enhanced financial stability and reduced leverage risk. Current liabilities showed some volatility, spiking to SAR 7,936.66 million in 2023 before moderating to SAR 5,909.43 million in 2024, likely reflecting project financing dynamics and working capital requirements tied to large-scale infrastructure development cycles. This balance sheet evolution supports ACWA Power's long-term growth strategy while maintaining financial flexibility for future expansion opportunities.
Cashflow analysis
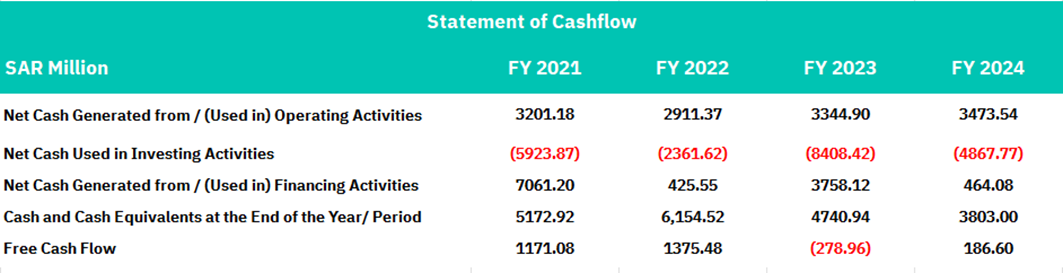
ACWA Power has maintained strong operational cash generation throughout the 2021-2024 period, with operating cash flows growing from SAR 3,201.18 million in 2021 to SAR 3,473.54 million in 2024, demonstrating the company's ability to convert earnings into cash effectively. The temporary dip to SAR 2,911.37 million in 2022 was followed by robust recovery to SAR 3,344.90 million in 2023, indicating resilient underlying business fundamentals. This consistent operating cash flow generation of over SAR 3 billion annually provides ACWA Power with substantial financial flexibility to fund growth initiatives and service its capital requirements. The strong and stable operating cash flows reflect the predictable revenue streams typical of long-term power purchase agreements and infrastructure concessions that characterize the company's business model.
However, the company's significant investment activities have created challenges for free cash flow generation, with investing cash outflows consistently exceeding SAR 2.3 billion annually and reaching SAR 8,408.42 million in 2023. This heavy capital deployment reflects ACWA Power's aggressive expansion strategy in renewable energy projects and infrastructure development. Financing activities have been variable, generating substantial inflows of SAR 7,061.20 million in 2021 and SAR 3,758.12 million in 2023, likely from project financing and debt issuances to fund expansion. Free cash flow has been volatile, turning negative SAR 278.96 million in 2023 before recovering to positive SAR 186.60 million in 2024, indicating the capital-intensive nature of the business and the timing challenges of large infrastructure investments. While the negative free cash flow in 2023 reflects peak investment activity, the return to positive territory in 2024 suggests improving cash conversion as projects reach operational phases and begin generating returns.
Conclusion
ACWA Power represents a compelling investment opportunity in the global energy transition, positioned as a dominant infrastructure operator with significant competitive advantages and strong sovereign backing. The company's strategic positioning as the world's largest private desalination company with over 40% market share, combined with its 78.9 GW of managed power generation capacity (60%+ renewable), provides substantial defensive moats and diversified revenue streams. With Saudi Arabia's Public Investment Fund and state entities holding nearly 65% ownership, ACWA Power benefits from unparalleled project pipeline visibility and credit enhancement, evidenced by the recent US$8.3 billion contract wins and an ambitious US$250 billion asset scale target by 2030. The company's global expansion strategy across high-growth emerging markets, including China (US$30-75 billion planned investment), Malaysia (US$1 billion floating PV project), and West Africa (US$800 million Senegal desalination project), demonstrates management's ability to capitalize on infrastructure gaps while maintaining disciplined capital allocation.
However, near-term financial performance presents mixed signals that warrant careful monitoring despite the strong strategic positioning. While revenue growth of 6.35% CAGR and consistent gross margins above 50% demonstrate operational resilience, the concerning deterioration in operating margins (negative 8.88% CAGR) and compressed net profit margins (from 21.53% to 15.65%) indicate execution challenges that require management attention. The volatile free cash flow profile, including the negative SAR 279 million in 2023, reflects the capital-intensive nature of the business but raises questions about cash conversion efficiency during peak investment cycles. Nevertheless, the strengthened balance sheet with improved debt-to-equity ratio (2.19x to 1.34x) and robust operating cash flows exceeding SAR 3 billion annually provides financial flexibility to navigate the investment phase. Given the company's first-mover advantage in green hydrogen (1 million tons annual capacity by 2026), secular tailwinds from global decarbonization trends, and strong sovereign support, reflecting the premium valuation justified by its strategic assets and long-term growth trajectory, while acknowledging near-term margin pressure risks that could impact quarterly performance.
Disclaimer:
Sahm is subject to the supervision and control of the CMA, pursuant to its license no. 22251-25 issued by CMA.
The Information presented above is for information purposes only, which shall not be intended as and does not constitute an offer to sell or solicitation for an offer to buy any securities or financial instrument or any advice or recommendation with respect to such securities or other financial instruments or investments. When making a decision about your investments, you should seek the advice of a professional financial adviser and carefully consider whether such investments are suitable for you in light of your own experience, financial position and investment objectives. The firm and its analysts do not have any material interests or conflicts of interest in any companies mentioned in this report.
Performance data provided is accurate and sourced from reliable platforms, including Argaam, ACWA Power official disclosures, financial reports, and managemeent interviews.
IN NO EVENT SHALL SAHM CAPITAL FINANCIAL COMPANY BE LIABLE FOR ANY DAMAGES, LOSSES OR LIABILITIES INCLUDING WITHOUT LIMITATION, DIRECT OR INDIRECT, SPECIAL, INCIDENTAL, CONSEQUENTIAL DAMAGES, LOSSES OR LIABILITIES, IN CONNECTION WITH YOUR RELIANCE ON OR USE OR INABILITY TO USE THE INFORMATION PRESENTED ABOVE, EVEN IF YOU ADVISE US OF THE POSSIBILITY OF SUCH DAMAGES, LOSSES OR EXPENSES.