
Saudi Market
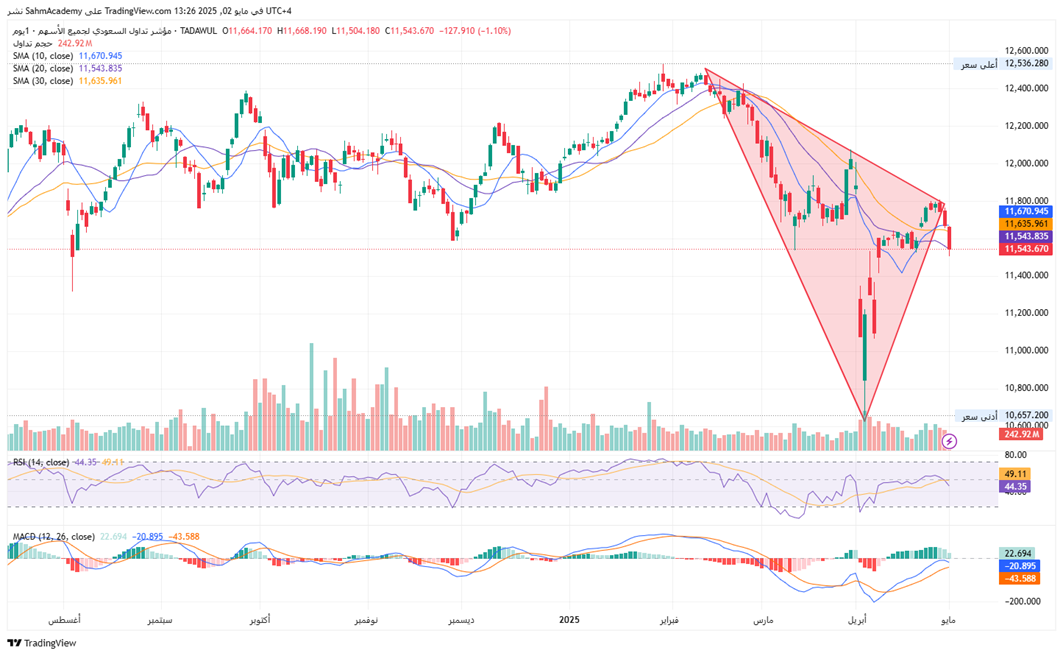
TASI Technical Analysis:
The TASI is in a clear downtrend since February 2025. It's below the 10-day (11,670.945) and 30-day (11,635.961) SMAs, and at the 20-day SMA (11,543.835) level. The index has formed a descending triangle pattern since March, with lower highs and horizontal support around 11,400, indicating bearish momentum.
RSI (14): 44.35 - Below the center line, indicating bearish momentum but not yet oversold, MACD line (22.694) above signal line, but histogram showing negative values (-20.895, -43.588). The recent MACD crossover suggests potential weakness ahead.
TASI Index Weekly Market Summary (April 27 to May 1)
The TASI index decreased by 1.81%. With a trading week of 5 days, the total trading volume reached 29 billion Saudi Riyals, averaging 5.9 billion per day.
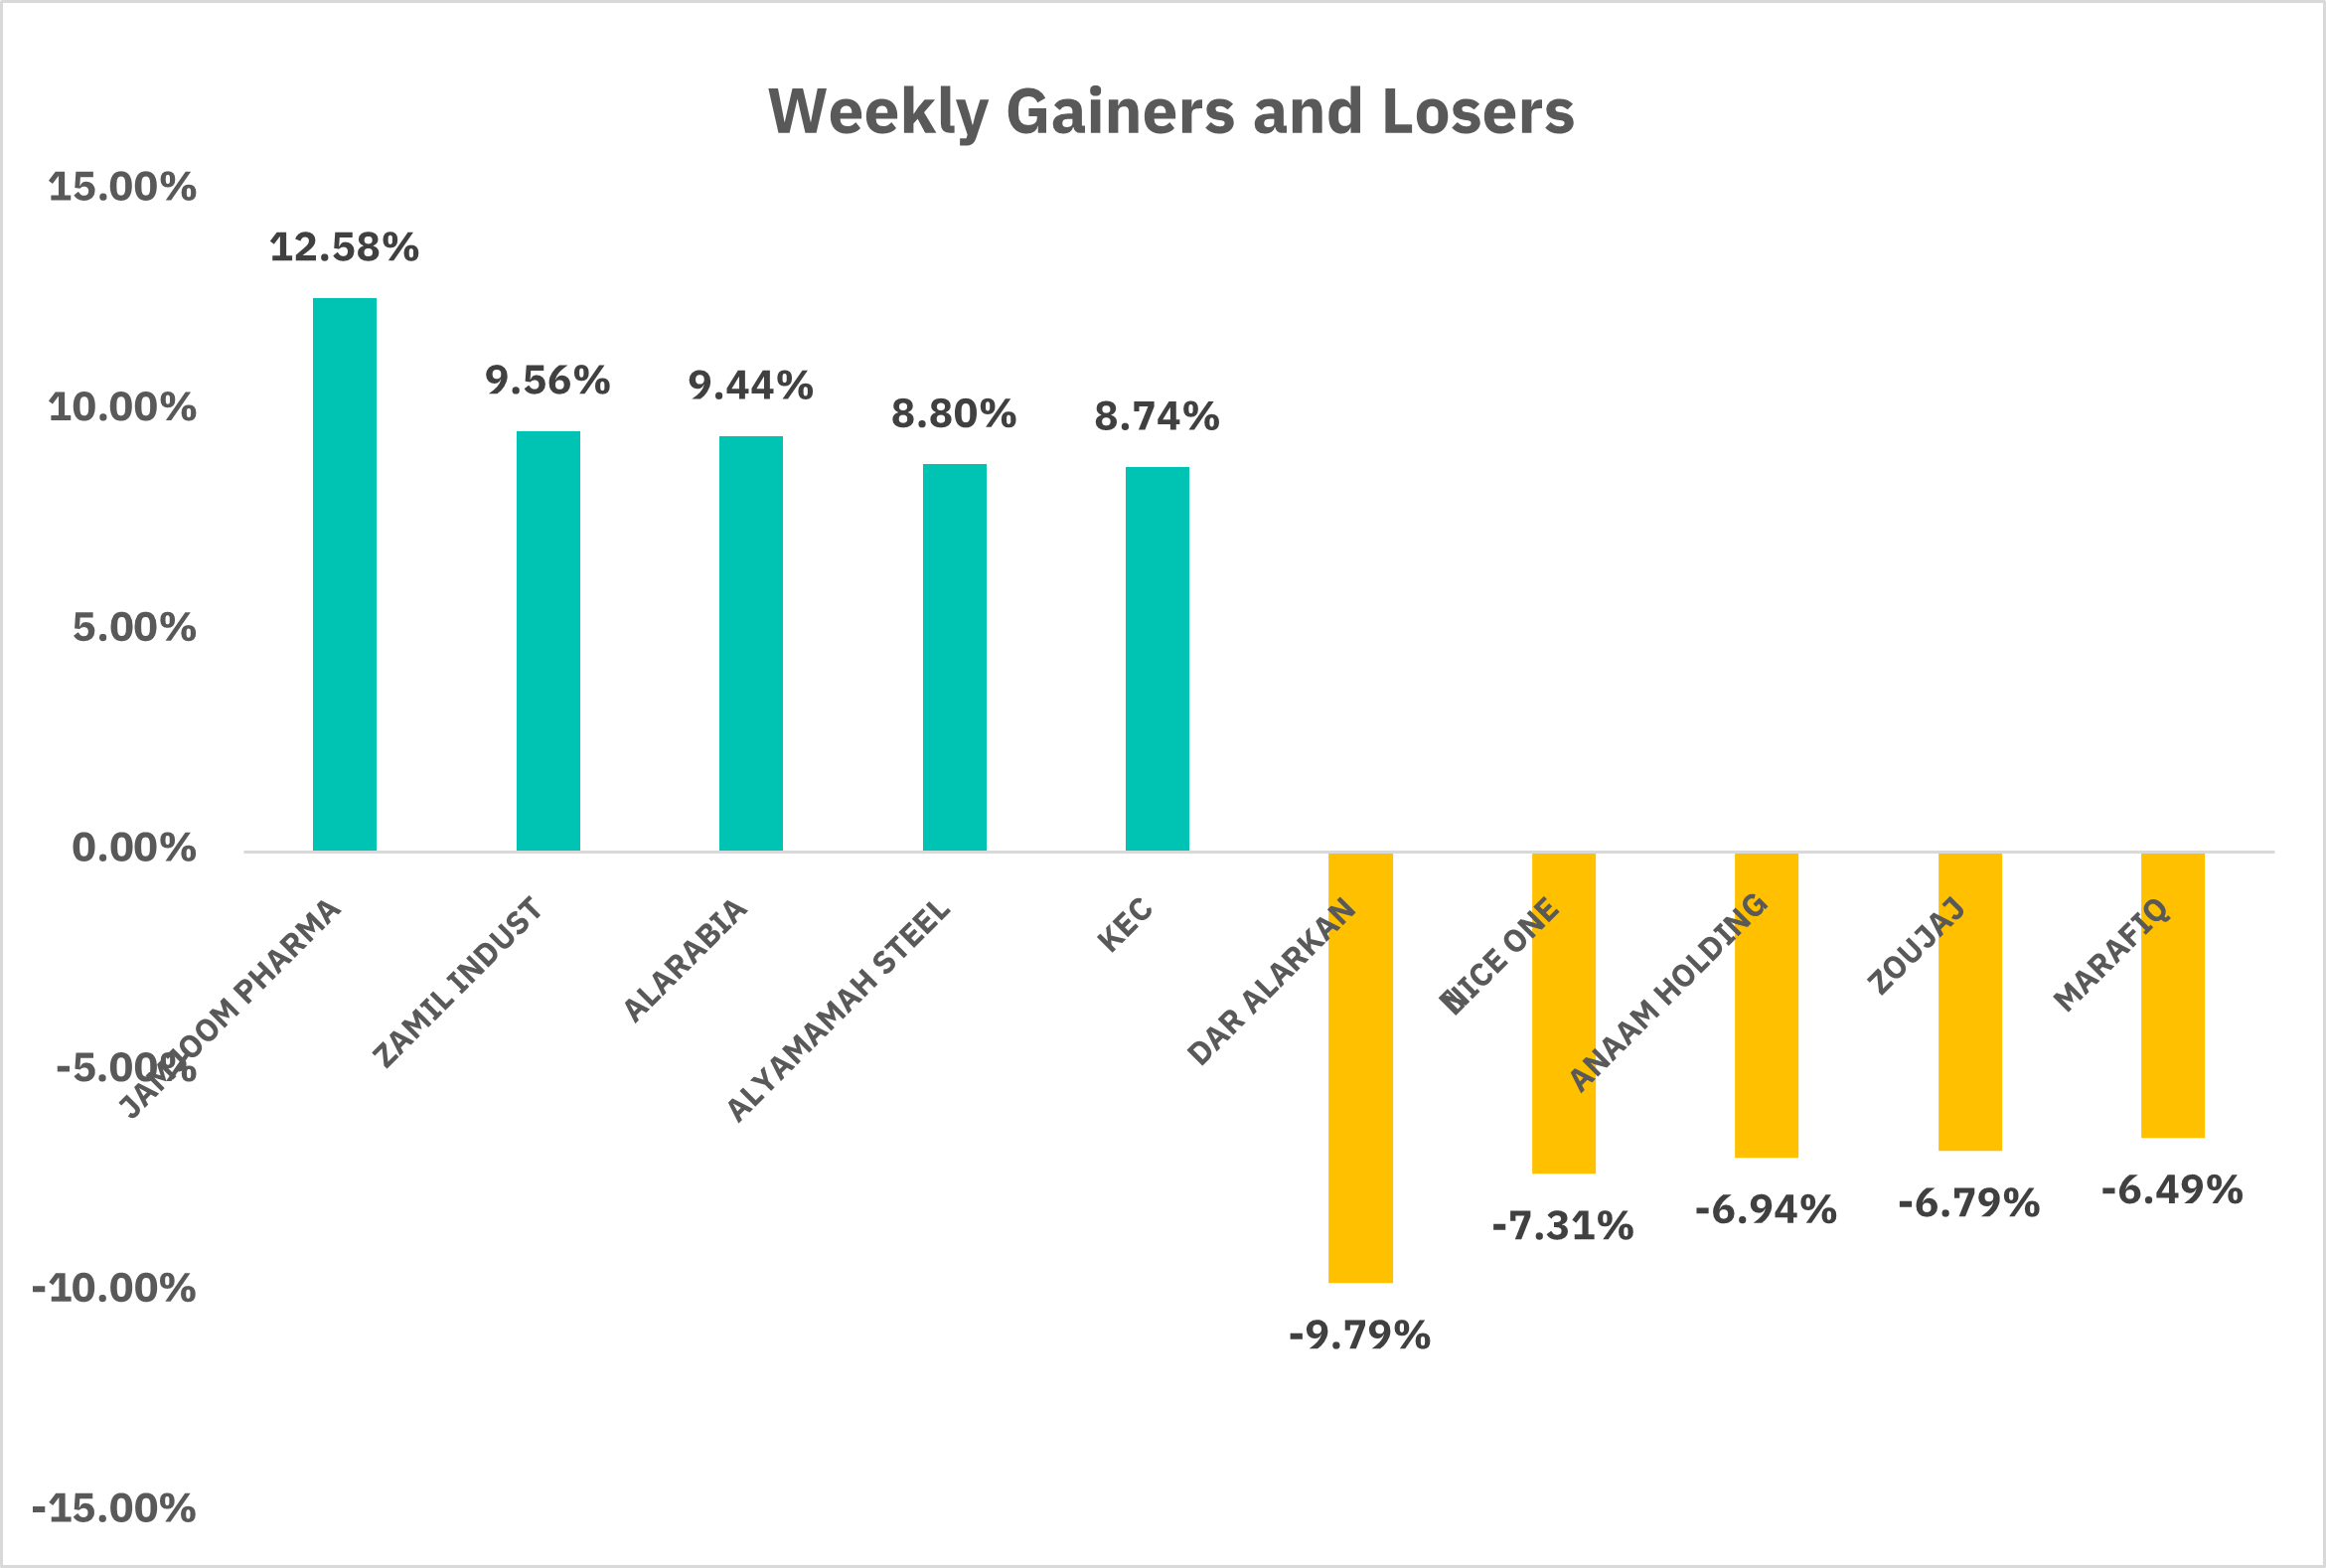
From the perspective of individual stock performance, 46 companies saw their stock prices rise this week, while 221 companies saw their stock prices fall. The companies with the highest increase included JAMJOOM PHARMA, ZAMIL INDUST, ALARABIA, with increases of 12.58%, 9.56%, and 9.44% respectively. The companies with the highest decline included DAR ALARKAN, NICE ONE, ANAAM HOLDING , with declines of 9.79%, 7.31%, and 6.94% respectively.
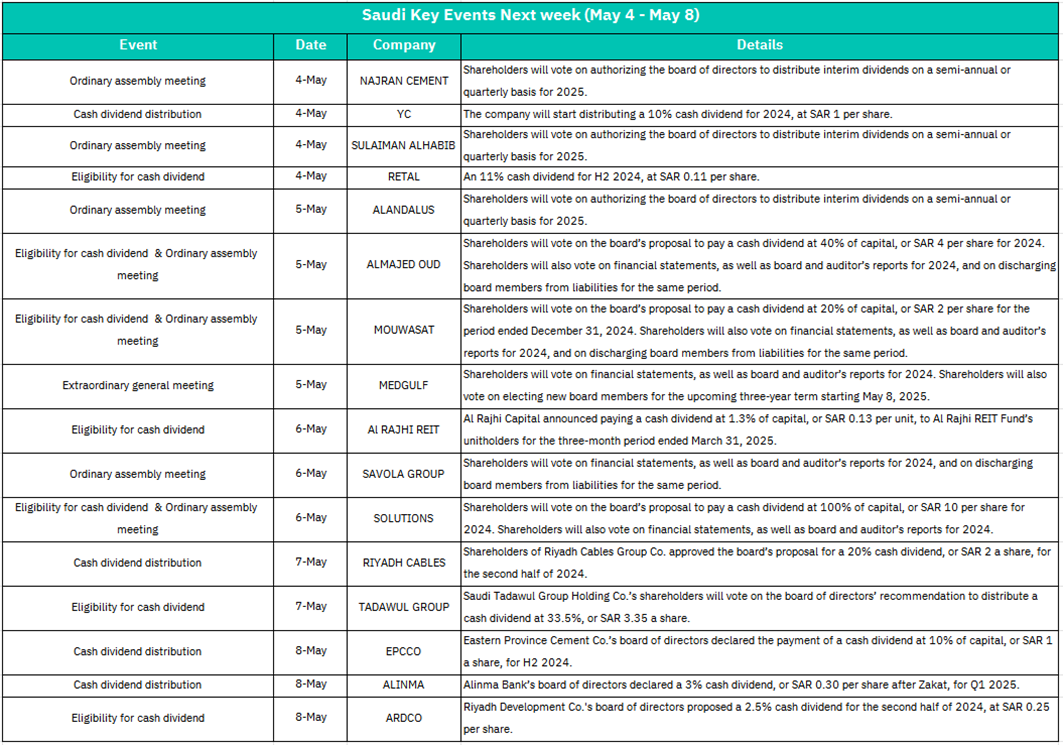
1.May 4– Ordinary Assembly Meetings
NAJRAN CEMENT and SULAIMAN ALHABIB: Shareholders to vote on authorizing interim dividends (semi-annual/quarterly) for 2025. Positive sentiment likely as dividend flexibility signals financial stability and shareholder-friendly policies.
– Cash Dividend Distribution
YC: Starts distributing a 10% cash dividend (SAR 1/share) for 2024.
RETAL: Eligibility for 11% H2 2024 dividend (SAR 0.11/share).
Immediate boost to share prices for YC and RETAL due to investor demand for yield.
2. May 5 – Ordinary/Extraordinary Meetings
ALANDALUS: Vote on interim dividends for 2025.
ALMAJED OUD: Proposal for 40% cash dividend (SAR 4/share) for 2024.
MOUWASAT: Approval of 2024 financials and board liability discharge.
MEDGULF: Vote on 2024 financials.
ALMAJED OUD’s high dividend proposal (40%) could drive speculative buying. Approval of financials (Mouwasat/Medgulf) may stabilize investor confidence.
3. May 6 –Dividend Eligibility & Meetings:
Al RAJHI REIT: Paying a cash dividend at 1.3% of capital.
SAVOLA GROUP: Vote on 2024 financials and board liability discharge.
SOLUTIONS: Proposal for 100% cash dividend (SAR 10/share) for 2024.
SOLUTIONS’s 100% dividend (SAR 10/share) may trigger significant short-term trading activity.
4. May 7 – Dividend Distribution
RIYADH CABLES: 20% cash dividend (SAR 2/share) for H2 2024.
TADAWUL GROUP: Vote on 33.5% dividend (SAR 3.35/share).
TADAWUL’s large payout (33.5%) could attract institutional investors, boosting liquidity.
5. May 8 – Dividend Actions
EPCCO: 10% cash dividend (SAR 1/share) for H2 2024.
ALINMA Bank: 3% dividend (SAR 0.30/share post-Zakat) for Q1 2025.
ARDCO: Proposed 2.5% dividend (SAR 0.25/share) for H2 2024.
Alinma’s early 2025 dividend signals strong Q1 performance, potentially lifting banking sector sentiment.
U.S. Market
S&P500 Technical Analysis:
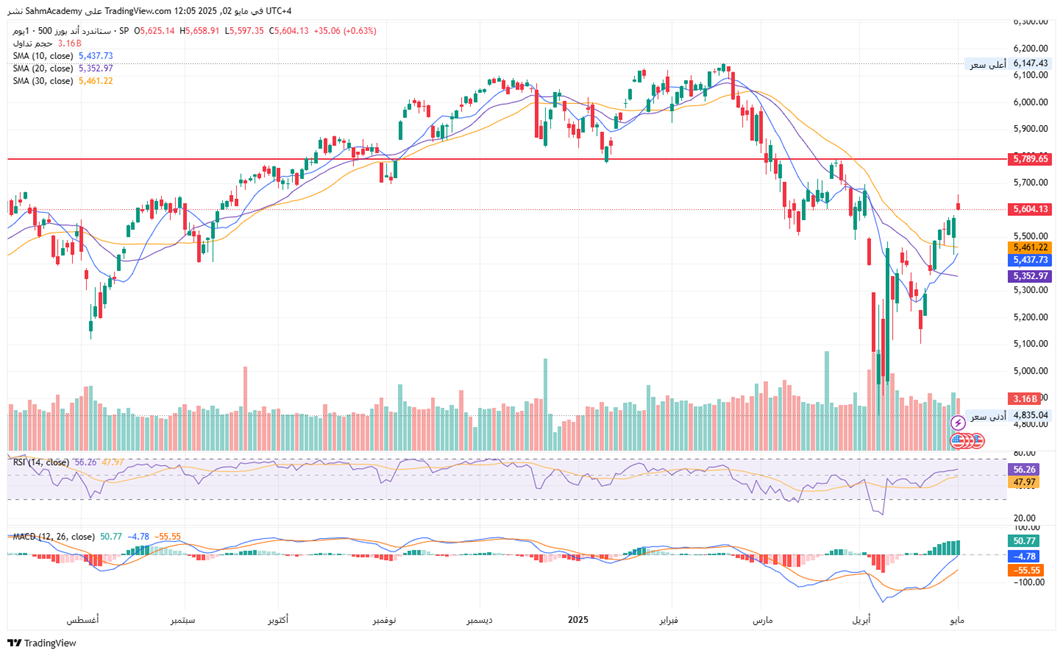
The S&P 500 Index, currently at $5,604.13, is in recovery mode after a significant April correction. It is trading above the 10-day ($5,437.73), 20-day ($5,352.97), and 30-day ($5,461.22) SMAs, indicating a short-, medium-, and intermediate-term bullish trend. The index has formed a double bottom pattern at April lows near $5,100 and has broken out of a descending channel. The RSI (56.26) is bullish and trending above the midline, while the MACD (50.77) shows strong positive momentum. In the short term (1-2 weeks), if the index breakout $5,789.05. A successful breakout could lead to the $5,800-$5,900 zone, with support expected at the 30-day SMA ($5,461.22).
The S&P 500 Index, currently at $5,604.13, is in recovery mode after a significant April correction. It is trading above the 10-day ($5,437.73), 20-day ($5,352.97), and 30-day ($5,461.22) SMAs, indicating a short-, medium-, and intermediate-term bullish trend. The index has formed a double bottom pattern at April lows near $5,100 and has broken out of a descending channel. The RSI (56.26) is bullish and trending above the midline, while the MACD (50.77) shows strong positive momentum. In the short term (1-2 weeks), if the index breakout $5,789.05. A successful breakout could lead to the $5,800-$5,900 zone, with support expected at the 30-day SMA ($5,461.22).
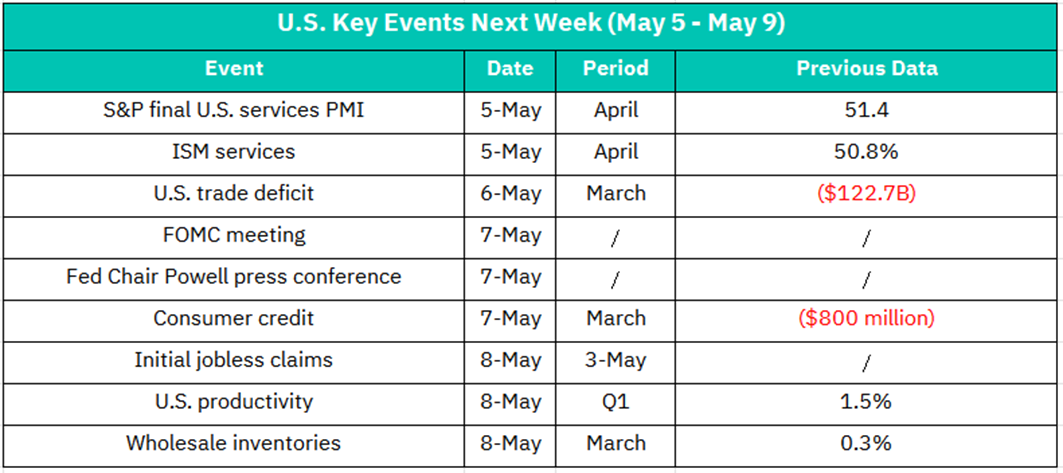
1. May 5 – S&P Final U.S. Services PMI (April)
Previous: 51.4 (indicating marginal expansion).
A reading above 50 signals growth. A higher-than-expected PMI could boost optimism for the services sector, lifting stocks in hospitality, retail, and tech. Conversely, a drop may trigger concerns about economic slowdown.
– ISM Services (April)
Previous: 50.8% (barely in expansion territory).
Similar to PMI, a stronger ISM reading would reinforce confidence in consumer-driven sectors. Weakness could weigh on cyclical stocks and increase volatility.
2. May 6 – U.S. Trade Deficit (March)
Previous: ($122.7B).
A widening deficit may pressure the dollar and export-oriented industries (e.g., manufacturing). A narrowing deficit could signal stronger domestic demand, benefiting sectors like retail and energy.
3. May 7 – FOMC Meeting & Powell Press Conference
Focus: Fed’s stance on interest rates and inflation.
Markets will scrutinize Powell’s tone for hints of rate cuts or hawkish signals. A dovish tilt (e.g., openness to easing) could rally equities, especially tech and growth stocks. Hawkish remarks may trigger bond yield spikes and equity sell-offs.
– Consumer Credit (March)
Previous: ($800M).
Rising consumer credit suggests stronger spending, potentially boosting retail and discretionary stocks. A contraction might signal weakening consumer confidence, affecting sectors reliant on discretionary income.
4. May 8– Initial Jobless Claims (Week Ending May 3)
Lower claims indicate a resilient labor market, supporting bullish sentiment for consumer and industrial stocks. A surprise rise could revive recession fears, pressuring cyclical sectors.
– U.S. Productivity (Q1)
Previous: 1.5%.
Higher productivity signals efficient corporate output, lifting tech and industrials. Stagnation may raise concerns about profit margins and inflation persistence.
– Wholesale Inventories (March)
Previous: 0.3%.
Rising inventories could signal weak demand, weighing on logistics and manufacturing stocks. A decline might indicate restocking needs, benefiting suppliers.
Crypto ETF Technical Analysis:
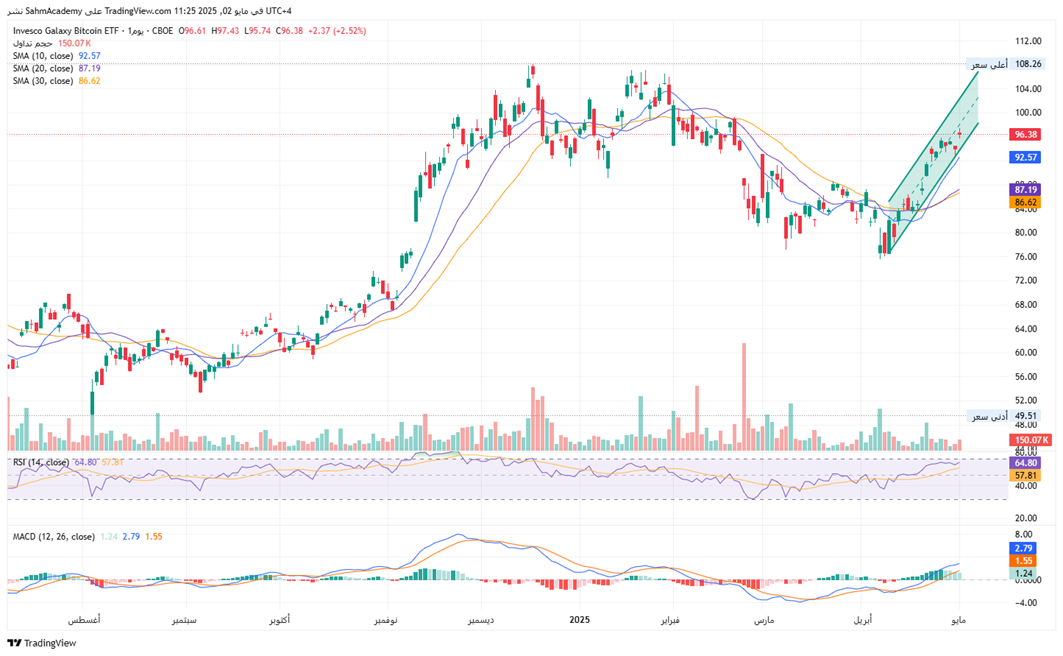
The Invesco Galaxy Bitcoin ETF (BTCO) is currently consolidating within a well-defined ascending channel, following a sustained bullish trajectory from April lows. Momentum indicators, including an RSI of 64.80 and a positive MACD at 1.24, suggest retained upward bias, while elevated trading volume during the initial breakout phase underscores genuine accumulation. Immediate support is anchored near the 10-day SMA and lower channel boundary, with critical downside thresholds clustered around the 86–87 USD confluence.
The broader technical structure remains constructive, with channel projections implying potential upside continuation, contingent on holding key support levels. Institutional participation and Bitcoin’s macro drivers, such as halving dynamics, may further reinforce medium-term bullish sentiment. While short-term profit-taking has introduced minor negative divergence in the MACD histogram, the absence of excessive volume during the correction signals orderly retracement rather than distribution.
Disclaimer:
Sahm is subject to the supervision and control of the CMA, pursuant to its license no. 22251-25 issued by CMA.
The Information presented above is for information purposes only, which shall not be intended as and does not constitute an offer to sell or solicitation for an offer to buy any securities or financial instrument or any advice or recommendation with respect to such securities or other financial instruments or investments. When making a decision about your investments, you should seek the advice of a professional financial adviser and carefully consider whether such investments are suitable for you in light of your own experience, financial position and investment objectives. The firm and its analysts do not have any material interests or conflicts of interest in any companies mentioned in this report.
Performance data provided is accurate and sourced from reliable platforms, including Argaam, TradingView, MarketWatch.
IN NO EVENT SHALL SAHM CAPITAL FINANCIAL COMPANY BE LIABLE FOR ANY DAMAGES, LOSSES OR LIABILITIES INCLUDING WITHOUT LIMITATION, DIRECT OR INDIRECT, SPECIAL, INCIDENTAL, CONSEQUENTIAL DAMAGES, LOSSES OR LIABILITIES, IN CONNECTION WITH YOUR RELIANCE ON OR USE OR INABILITY TO USE THE INFORMATION PRESENTED ABOVE, EVEN IF YOU ADVISE US OF THE POSSIBILITY OF SUCH DAMAGES, LOSSES OR EXPENSES.
