Saudi Market
TASI Technical Analysis:
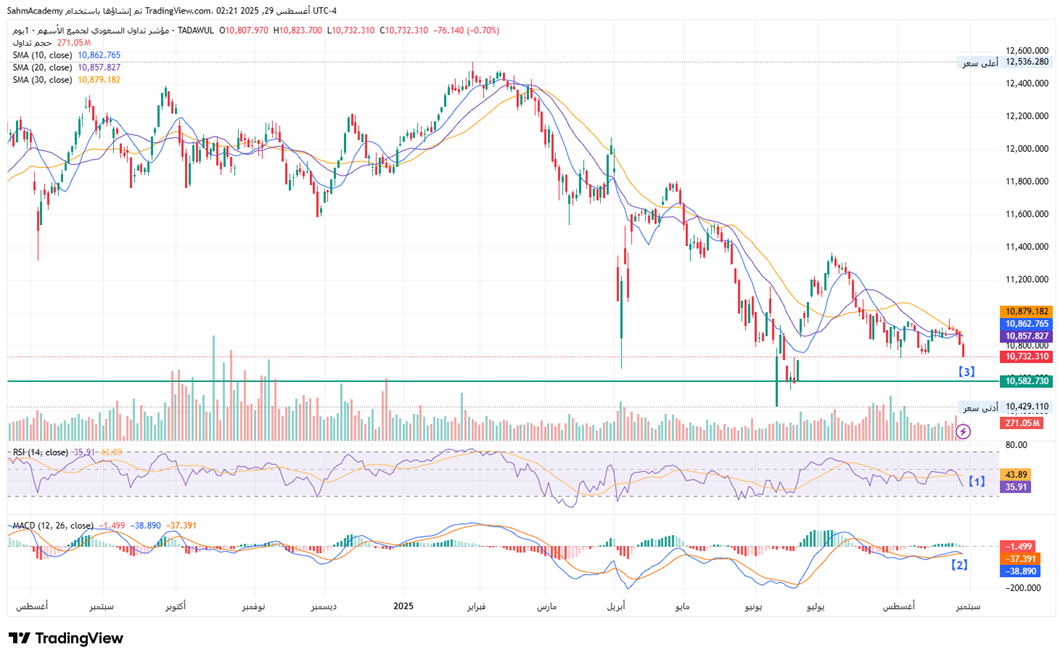
TASI presents a bearish outlook with the index currently trading at 10,732.310, down 0.70% from the previous session. The price action shows a clear downtrend that began from the February 2025 highs around 12,500 levels, with the index breaking below critical support levels. The moving average structure is decisively bearish, with the 10-day SMA (10,862.765), 20-day SMA (10,857.827), and 30-day SMA (10,879.182) all trading above the current price and acting as dynamic resistance.
[1] The momentum indicators further confirm the bearish sentiment, with the RSI reading at 35.91, indicating oversold conditions but without showing clear divergence that would suggest an imminent reversal.
[2] The MACD histogram shows persistent negative momentum at -38.890, with the MACD line trading well below the signal line, reinforcing the downside pressure. Volume patterns suggest distribution, particularly during the recent decline phases.
[3] A decisive break below 10,700 would likely accelerate the decline toward the 10,582 support region.
TASI Index Weekly Market Summary (August 24 to August 28)
The TASI index decreased by 1.58%. With a trading week of 5 days, the total trading volume reached 23 billion Saudi Riyals, averaging 4.6 billion per day.
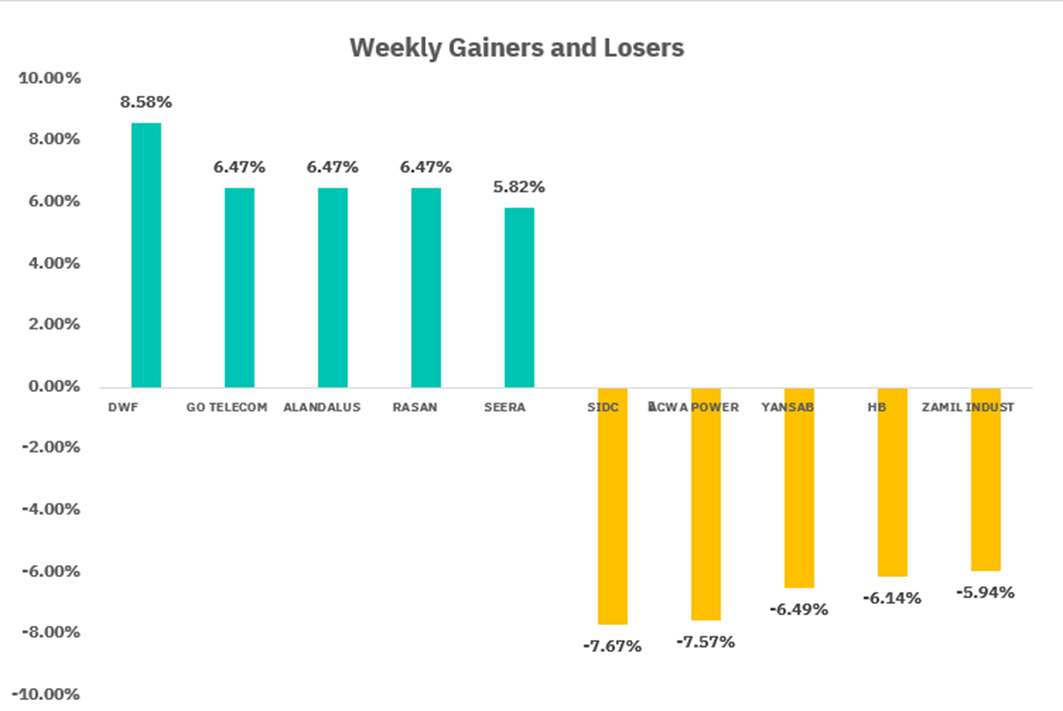
From the perspective of individual stock performance, 89 companies saw their stock prices rise this week, while 177 companies saw their stock prices fall. The companies with the highest increase included DWF, GO TELECOM, ALANDALUS, with increases of 8.58%, 6.47%, and 6.47% respectively. The companies with the highest decline included SIDC, ACWA POWER, YANSAB with declines of 7.67%, 7.57 %, and 6.49% respectively.
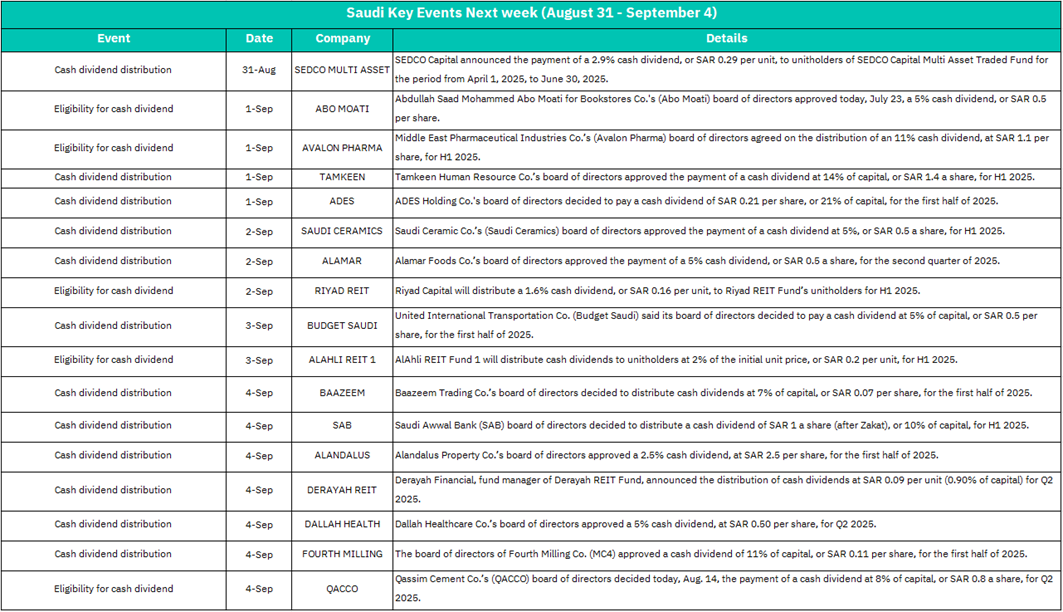
August 31 :
SEDCO MULTI ASSET - Cash dividend distribution (2.9% dividend, SAR 0.29/unit for period from April 1, 2025 to June 30, 2025)
Market Impact: MODERATE - Asset management sector showing consistent income distribution, supporting the growing mutual fund and investment management industry in Saudi Arabia.
September 1:
ABO MOATI - Cash dividend eligibility (8.5% dividend, SAR 0.5/share)
AVALON PHARMA - Cash dividend eligibility (11% dividend, SAR 1.1/share for H1 2025)
TAMKEEN - Cash dividend distribution (24% of capital, SAR 1.4/share for H1 2025)
ADES - Cash dividend distribution (21% of capital, SAR 0.21/share for H1 2025)
Market Impact: HIGH SIGNIFICANCE - TAMKEEN's exceptional 24% human resources dividend (SAR 1.4/share) leads the day, while AVALON PHARMA's 11% pharmaceutical dividend reinforces healthcare sector strength. Multiple high-yield distributions across diverse sectors.
September 2:
SAUDI CERAMICS - Cash dividend distribution (5% dividend, SAR 0.5/share for H1 2025)
ALAMAR - Cash dividend distribution (5% dividend, SAR 0.5/share for Q2 2025)
RIYAD REIT - Cash dividend eligibility (1.6% dividend, SAR 0.16/unit for H1 2025)
Market Impact: MODERATE - Building materials (SAUDI CERAMICS) and food sectors (ALAMAR) maintaining steady dividend policies. REIT sector showing consistent but modest income generation.
September 3:
BUDGET SAUDI - Cash dividend distribution (5% of capital, SAR 0.5/share for H1 2025)
ALAHLI REIT 1 - Cash dividend eligibility (2% of initial unit price, SAR 0.2/unit for H1 2025)
Market Impact: MODERATE - Transportation (BUDGET SAUDI) and REIT sectors maintaining regular distributions, though at more modest levels compared to other sectors.
September 4:
BAAZEEM - Cash dividend distribution (7% of capital, SAR 0.07/share for H1 2025)
SAB - Cash dividend distribution (10% of capital, SAR 1/share for H1 2025)
ALANDALUS - Cash dividend distribution (2.5% dividend, SAR 2.5/share for H1 2025)
DERAYAH REIT - Cash dividend distribution (0.90% of capital, SAR 0.09/unit for Q2 2025)
DALLAH HEALTH - Cash dividend distribution (5% dividend, SAR 0.50/share for Q2 2025)
FOURTH MILLING - Cash dividend distribution (11% of capital, SAR 0.11/share for H1 2025)
QACCO - Cash dividend eligibility (8% of capital, SAR 0.8/share for Q2 2025)
Market Impact: VERY HIGH SIGNIFICANCE - Peak distribution day with seven companies across multiple sectors. SAB's banking dividend (SAR 1/share) and ALANDALUS property dividend (SAR 2.5/share) provide substantial liquidity injection, while healthcare (DALLAH) maintains sector momentum.
U.S. Market
S&P500 Technical Analysis:
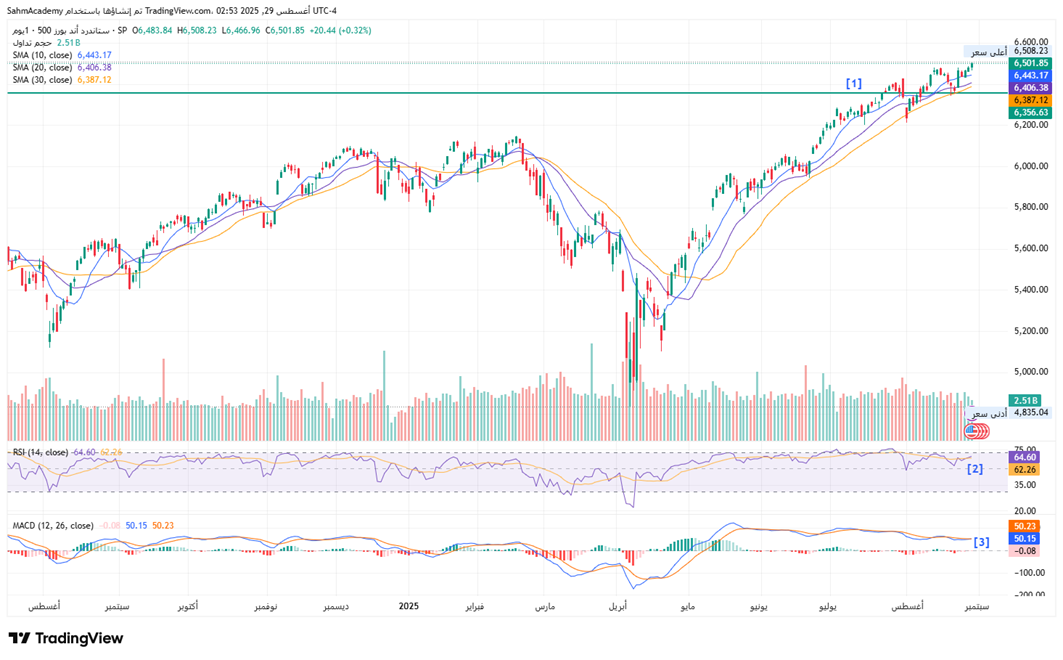
The S&P 500 Index continues to exhibit exceptional strength. The index has achieved a remarkable recovery from the March 2025 lows around 4,835, representing a powerful bull run of over 34% that has propelled the market to new all-time highs near 6,508. The moving average structure remains unequivocally bullish, with the 10-day SMA at 6,443.17, 20-day SMA at 6,406.38, and 30-day SMA at 6,387.12 all providing ascending support beneath current price levels. This alignment confirms the persistence of institutional buying and trend-following momentum.
[1] Key support now resides at the 6,356 zone, backed by the converging moving averages.
[2] Momentum indicators paint an optimistic picture for continued upside potential, though some caution is warranted given the extended nature of the rally. The RSI stands at 64.60, approaching overbought territory but not yet signaling an imminent reversal, suggesting room for further gains before a meaningful correction materializes.
[3] The MACD reading of 50.23 remains well above both the signal line and zero line, indicating sustained bullish momentum despite some recent moderation in the rate of advance.
While the market's proximity to all-time highs and stretched valuation metrics suggest increased volatility risk, the technical framework supports a continuation toward the 6,600-6,700 target zone. Any pullbacks toward the 6,350-6,400 support area should be viewed as strategic buying opportunities within the context of the dominant uptrend.
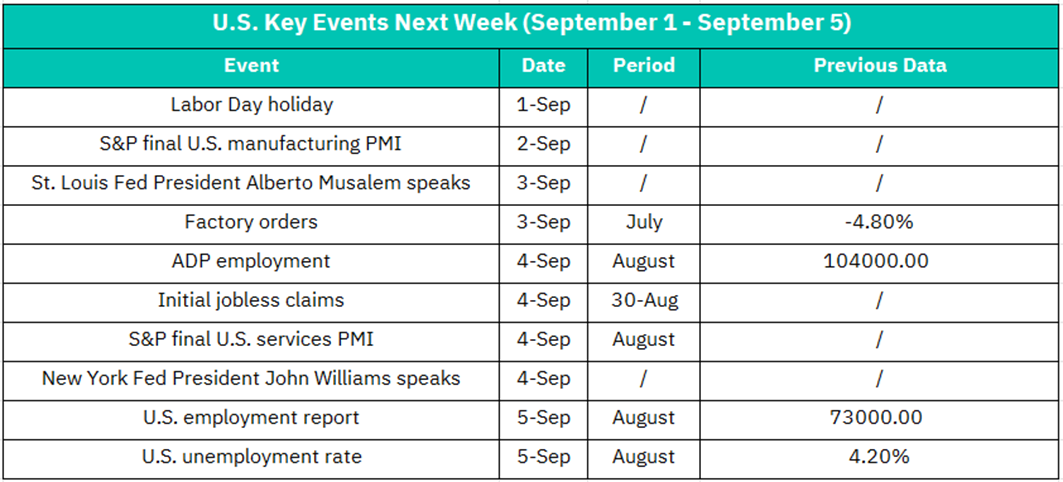
September 1:
Labor Day Holiday - U.S. markets closed
September 2:
S&P Final U.S. Manufacturing PMI - August final reading
Market Impact: MODERATE SIGNIFICANCE
• Final confirmation of manufacturing sector health
• Revision potential from flash estimate could surprise markets
• Industrial sector focus: Manufacturing companies, materials, machinery stocks
• Export implications: Dollar and trade-sensitive companies affected
September 3:
St. Louis Fed President Alberto Musalem speaks
Factory Orders - July data
Previous: -4.80%
Market Impact: HIGH SIGNIFICANCE
Fed communication critical for September FOMC meeting expectations
Factory orders recovery from severe -4.80% decline crucial for industrial confidence
Factory Orders Analysis:
Previous -4.80% indicates significant manufacturing weakness
Expected recovery essential for industrial sector sentiment
Supply chain implications for manufacturing and logistics companies
Capital goods orders component particularly important for business investment trends
September 4:
ADP Employment - August data
Previous: 104,000 jobs
Initial Jobless Claims - Week ending August 30
S&P Final U.S. Services PMI - August final reading
New York Fed President John Williams speaks
Market Impact: VERY HIGH SIGNIFICANCE
• Triple employment data day providing comprehensive labor market assessment
• Dual Fed speaker coverage offering policy insights ahead of September FOMC
ADP Employment Focus:
• Previous 104,000 suggests moderate job creation
• Leading indicator for Friday's official jobs report
• Private sector employment trends critical for consumer spending outlook
Services PMI Importance:
• Services = ~80% of U.S. economy
• Final reading confirmation of economic momentum
• Technology, healthcare, financial services sector implications
September 5:
U.S. Employment Report - August data
Previous: 73,000 jobs
Previous Unemployment Rate: 4.20%
Market Impact: MAXIMUM SIGNIFICANCE
• Most important economic release of the month
• Fed policy critical input for September meeting decisions
• Previous 73,000 jobs represents significant slowdown
Crypto ETF Technical Analysis:
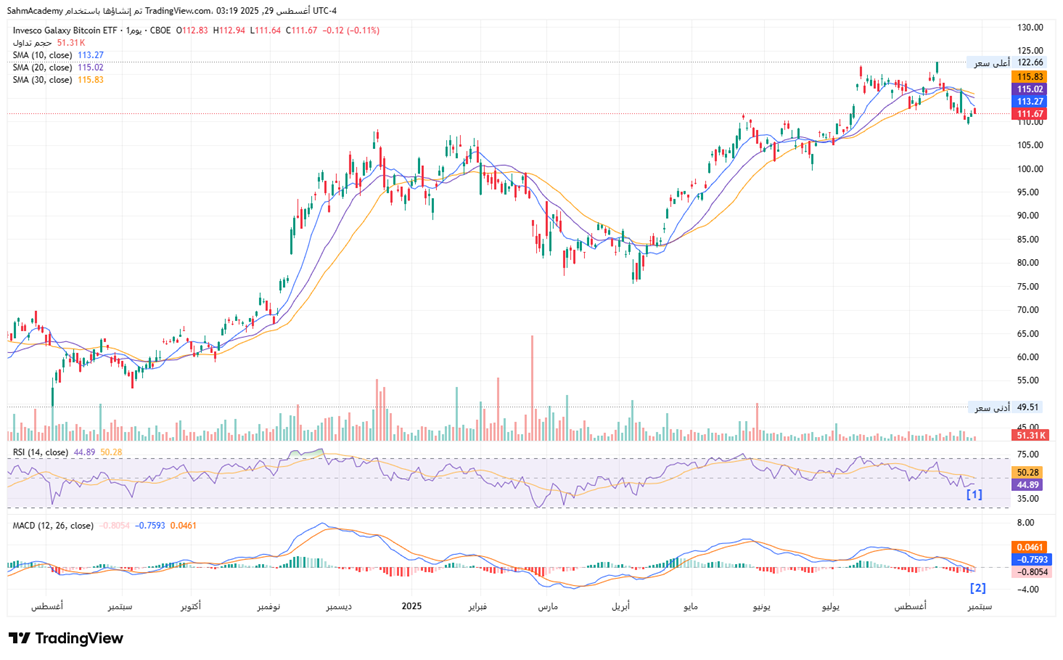
The BTCO is currently exhibiting signs of technical weakness. The ETF has experienced a significant correction from its August 2025 highs near $122.66, representing approximately a 9% decline that has broken through several key technical levels. The moving average structure presents a mixed picture, with the current price trading below the 10-day SMA at $113.27 and 20-day SMA at $115.02, while still maintaining support above the 30-day SMA at $115.83. This configuration suggests short-term bearish pressure with the potential for further downside if the 30-day moving average fails to hold.
[1] Technical indicators reveal deteriorating momentum that warrants caution for near-term positioning. The RSI currently reads 44.89, having declined from overbought levels and now approaching oversold territory, indicating potential for further weakness before a meaningful bounce materializes.
[2] The MACD configuration shows a reading of 0.0461, with the histogram trending negative and the MACD line approaching a potential bearish crossover below the signal line, confirming the loss of bullish momentum.
Volume patterns during the recent decline appear consistent with distribution, though the magnitude remains moderate. While the broader cryptocurrency market's volatility could provide sharp reversal opportunities, the technical structure suggests that any rallies toward the $115-$118 resistance zone should be viewed with skepticism. A decisive break below the $110 psychological support level would likely accelerate the correction toward the $105-$107 area, where more substantial buying interest may emerge.
Disclaimer:
Sahm is subject to the supervision and control of the CMA, pursuant to its license no. 22251-25 issued by CMA.
The Information presented above is for information purposes only, which shall not be intended as and does not constitute an offer to sell or solicitation for an offer to buy any securities or financial instrument or any advice or recommendation with respect to such securities or other financial instruments or investments. When making a decision about your investments, you should seek the advice of a professional financial adviser and carefully consider whether such investments are suitable for you in light of your own experience, financial position and investment objectives. The firm and its analysts do not have any material interests or conflicts of interest in any companies mentioned in this report.
Performance data provided is accurate and sourced from reliable platforms, including Argaam, TradingView, MarketWatch.
IN NO EVENT SHALL SAHM CAPITAL FINANCIAL COMPANY BE LIABLE FOR ANY DAMAGES, LOSSES OR LIABILITIES INCLUDING WITHOUT LIMITATION, DIRECT OR INDIRECT, SPECIAL, INCIDENTAL, CONSEQUENTIAL DAMAGES, LOSSES OR LIABILITIES, IN CONNECTION WITH YOUR RELIANCE ON OR USE OR INABILITY TO USE THE INFORMATION PRESENTED ABOVE, EVEN IF YOU ADVISE US OF THE POSSIBILITY OF SUCH DAMAGES, LOSSES OR EXPENSES.