Company Overview:
Saudi Chemical Company Holdings operates as a holding company with five specialized subsidiaries. The company was founded in 1972 and currently employs approximately 330 people across its operations.
Business Segments
Medicines & Medical Supplies (Primary Revenue Driver) The company operates in three segments: Explosives, Medicines & Medical Supplies, and Production of Ammonium Nitrate. It generates the majority of its revenue from Medicines & medical supplies. This segment includes pharmaceutical trading, distribution, and medical equipment supply to hospitals and healthcare centers throughout Saudi Arabia.
Explosives Manufacturing: Manufacturing explosives for civil purposes. Manufacturing explosives for military purposes. The company serves both commercial mining operations and defense sector requirements, providing specialized explosive products and related services.
Ammonium Nitrate Production Industrial chemical production focusing on ammonium nitrate, primarily serving agricultural and industrial applications across the region.
Subsidiary Structure
The company's portfolio includes:
- Saudi Chemical Company Limited
- Saudi International Trading Company
- AJA Pharma
- Suez International Nitrate Company
- Additional specialized subsidiaries
Industry Analysis & Market Position
Global and Regional Chemical Industry Dynamics
The global chemical industry is experiencing a prolonged down cycle, primarily caused by overbuilding and excess capacity. This challenging environment has affected even industry giants, with Saudi Aramco's CFO noting that the chemicals industry is going through a "very long down cycle". Despite this backdrop, certain segments within the chemical sector continue to show resilience and growth potential.
The Saudi Arabian chemical logistics market is expected to grow from $10.64 billion in 2024 to $14.27 billion by 2029, at a CAGR of 6.12%. This growth is driven by increasing chemical production and demand across various end-user industries. The kingdom's strategic investments in gas field development to increase natural gas production (with Saudi Aramco planning to increase gas production by 50% by 2030) will provide competitive feedstock pricing and support chemical production.
Saudi Pharmaceutical and Healthcare Sector
SCHC's pharmaceutical trading segment benefits from Saudi Arabia's growing pharmaceutical industry. The kingdom's pharmaceutical sector is expected to export over SAR 1.5 million annually and is growing at approximately 5% per year. With more than 40 recognized pharmaceutical enterprises meeting 36% of the country's medical needs, this segment represents a stable demand source for SCHC's medical trading operations.
Competitive Landscape
SCHC operates in a fragmented competitive environment across its business segments. In explosives, the company faces competition from global chemical giants such as SABIC (ranked 2nd in global chemical brand value at $4.89 billion) and various international players. In the pharmaceutical trading segment, competition comes from regional distributors and global logistics specialists operating in the kingdom.
The company's competitive advantage stems from its long-established presence in the Saudi market (since 1972), its diversified business model, and its strategic focus on sectors aligned with Saudi Arabia's Vision 2030 economic diversification goals.
Valuation:
Income statement analysis
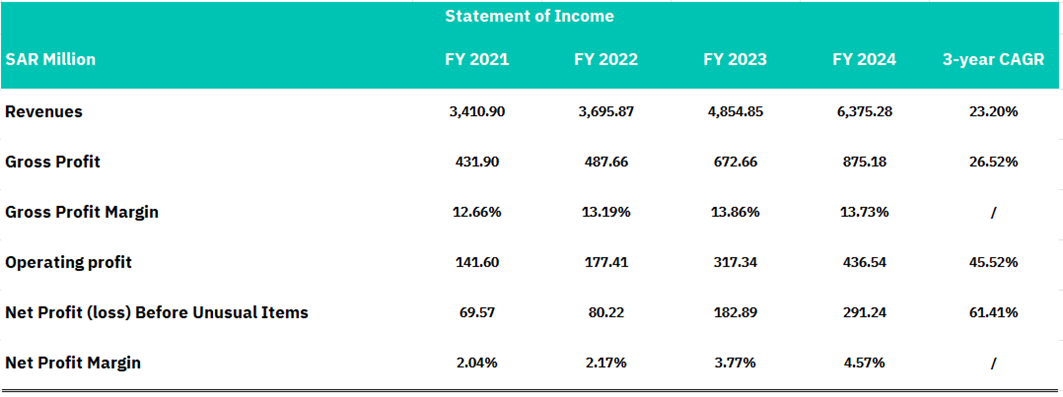
Revenue experienced remarkable expansion from SAR 3,411 million in FY 2021 to SAR 6,375 million in FY 2024, representing an outstanding 23.20% compound annual growth rate (CAGR). This revenue momentum translates into strong bottom-line results, with net profit before unusual items surging from SAR 69.57 million to SAR 291.24 million over the same period, achieving an impressive 61.41% CAGR. The company's operating leverage is evident as operating profit grew even more aggressively at a 45.52% CAGR, reaching SAR 436.54 million in FY 2024, indicating effective cost management and operational efficiency improvements.
The profitability analysis reveals a maturing business model with expanding margins across the evaluation period. Gross profit margins remained relatively stable around 13%, fluctuating between 12.66% and 13.86%, demonstrating consistent pricing power and cost control in core operations. More notably, net profit margins showed sustained improvement from 2.04% in FY 2021 to 4.57% in FY 2024, reflecting enhanced operational efficiency and scale benefits. The acceleration in profit growth compared to revenue growth suggests successful cost leverage and operational optimization. This margin expansion, combined with the substantial revenue growth, positions Saudi Chemical as a high-performing entity within the chemical sector.
Balance sheet analysis
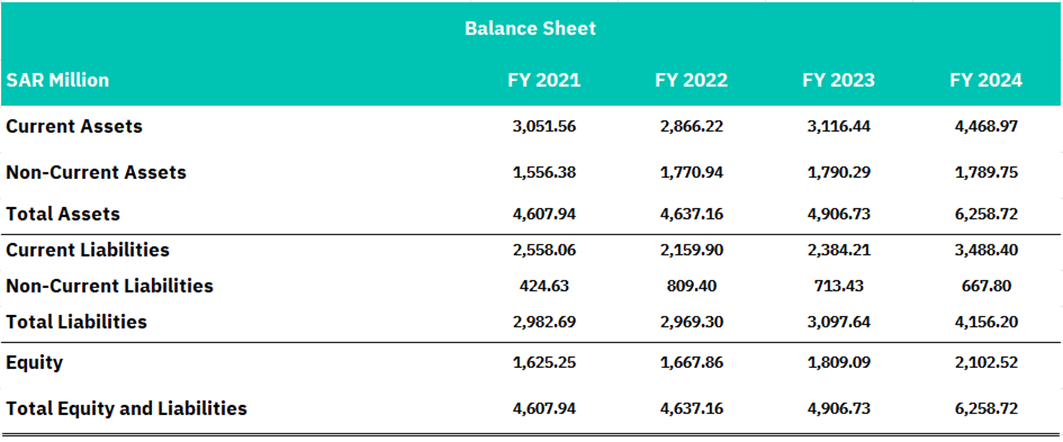
Saudi Chemical's balance sheet reflects a company in a significant growth and expansion phase, with total assets increasing substantially from SAR 4,608 million in FY 2021 to SAR 6,259 million in FY 2024, representing a 35.8% growth over the three years. The asset composition shows a notable shift toward current assets, which expanded dramatically from SAR 3,052 million to SAR 4,469 million, indicating stronger liquidity positioning and potentially increased working capital requirements to support the company's rapid revenue growth. Non-current assets remained relatively stable around SAR 1.8 billion, suggesting the company has maintained its fixed asset base while scaling operations, which could indicate efficient asset utilization or completion of a major capital investment cycle.
The liability structure reveals mixed trends that warrant careful monitoring from a credit perspective. Current liabilities increased significantly from SAR 2,558 million to SAR 3,488 million, growing at a faster pace than current assets and potentially indicating liquidity pressure despite the overall increase in current assets. Interestingly, non-current liabilities declined from SAR 425 million in FY 2021 to SAR 668 million in FY 2024 after peaking at SAR 809 million in FY 2022, suggesting potential debt restructuring or repayment activities. Total liabilities increased from SAR 2,983 million to SAR 4,156 million, representing a 39.3% growth that outpaced asset growth, indicating increased financial leverage.
From an equity perspective, Saudi Chemical demonstrates solid capital strength with shareholders' equity growing from SAR 1,625 million to SAR 2,103 million over the period, representing a healthy 29.4% increase. However, the debt-to-equity ratio has deteriorated as liabilities grew faster than equity, moving from approximately 1.84x in FY 2021 to 1.98x in FY 2024. While this leverage increase aligns with the company's growth trajectory and strong profitability shown in the income statement, investors should monitor working capital management closely, as the current ratio appears to be under pressure despite absolute increases in current assets. The overall balance sheet structure suggests a company successfully scaling its operations while maintaining reasonable capital adequacy.
Cashflow analysis
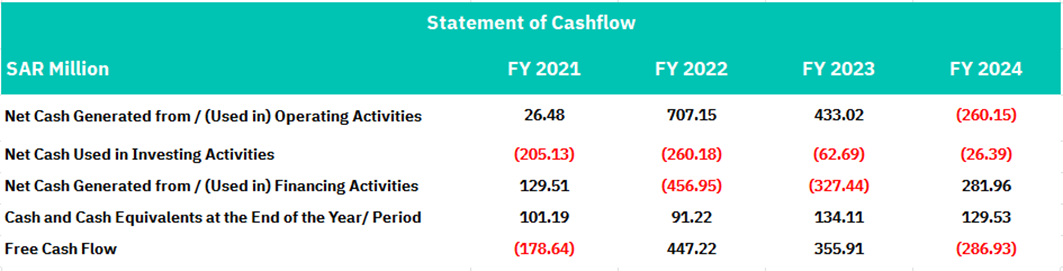
Saudi Chemical's cash flow statement reveals significant volatility in operating cash generation, highlighting the cyclical nature of the chemical industry and potential working capital challenges. Operating cash flow demonstrated extreme fluctuations, starting modestly at SAR 26.48 million in FY 2021, surging to an impressive SAR 707.15 million in FY 2022, maintaining strong performance at SAR 433.02 million in FY 2023, before turning sharply negative to SAR -260.15 million in FY 2024. This dramatic reversal in FY 2024 is particularly concerning given the company's strong profitability growth shown in the income statement, because the net decrease in operating assets reached 1,490.09 million. suggesting significant working capital absorption. The disconnect between reported profits and operating cash flow in FY 2024.
Investment activities remained consistently cash-consumptive throughout the period, though at manageable levels relative to the company's size. Capital expenditures averaged approximately SAR 139 million annually, peaking at SAR 260.18 million in FY 2022 and moderating to SAR 26.39 million in FY 2024. This investment pattern suggests the company completed a significant expansion or modernization program in FY 2022-2023, which aligns with the revenue growth trajectory observed in the income statement. The reduced capex in FY 2024 may indicate completion of this investment cycle, though management should ensure adequate maintenance capex to sustain competitive positioning and operational efficiency.
Financing activities show a company actively managing its capital structure to support growth initiatives and address cash flow volatility. The company raised substantial funds through financing activities in FY 2021 (SAR 129.51 million) and FY 2024 (SAR 281.96 million), while conducting significant cash returns or debt repayments in FY 2022 (SAR -456.95 million) and FY 2023 (SAR -327.44 million). Free cash flow turned significantly negative in FY 2021 and FY 2024 at SAR -178.64 million and SAR -286.93 million respectively, indicating the company's growth requires external financing. The cash position declined from SAR 134.11 million in FY 2023 to SAR 129.53 million in FY 2024, leaving limited liquidity buffers.
Conclusion
Saudi Chemical Company's 23.20% revenue CAGR and 61.41% net profit CAGR over FY2021-2024 demonstrate remarkable operational momentum, positioning it as a standout performer in an otherwise challenged global chemicals sector.
Robust Financial Performance: The company's revenue expansion from SAR 3.4 billion to SAR 6.4 billion, coupled with net profit margin improvement from 2.04% to 4.57%, reflects strong execution and operational leverage. The diversified business model across pharmaceuticals, explosives, and industrial chemicals provides defensive characteristics and multiple growth vectors.
Strategic Market Position: With over 50 years of established presence in Saudi Arabia, SCHC benefits from deep market relationships and regulatory familiarity. The company's alignment with Vision 2030 initiatives and exposure to the growing Saudi pharmaceutical sector (5% annual growth) position it favorably for continued expansion.
Sectoral Tailwinds: The Saudi chemical logistics market's projected growth from $10.64 billion to $14.27 billion by 2029 (6.12% CAGR), supported by Saudi Aramco's planned 50% increase in gas production, creates favorable operating conditions for sustained growth.
Key Concerns
Cash Flow Volatility: The dramatic reversal in operating cash flow from SAR 433 million in FY2023 to negative SAR 260 million in FY2024, despite strong profitability, raises significant questions about working capital management and cash conversion efficiency. This disconnect between earnings and cash generation is particularly concerning given the capital-intensive nature of the chemicals sector.
Deteriorating Liquidity Profile: The faster growth in current liabilities relative to current assets, combined with declining cash reserves and consistently negative free cash flow in recent periods, suggests potential liquidity constraints that could limit operational flexibility and growth financing capabilities.
Industry Headwinds: The prolonged downcycle in the global chemicals industry, acknowledged by industry leaders including Saudi Aramco, creates macro headwinds that could pressure margins and demand across SCHC's business segments.
Valuation Considerations
The company's strong profitability metrics and growth trajectory command a premium valuation within the regional chemicals sector. However, the cash flow volatility and working capital absorption introduce execution risk that must be appropriately discounted in any valuation framework. The debt-to-equity ratio increased to 1.98x, while manageable, requires monitoring given the cash generation challenges.
Disclaimer:
Sahm is subject to the supervision and control of the CMA, pursuant to its license no. 22251-25 issued by CMA.
The Information presented above is for information purposes only, which shall not be intended as and does not constitute an offer to sell or solicitation for an offer to buy any securities or financial instrument or any advice or recommendation with respect to such securities or other financial instruments or investments. When making a decision about your investments, you should seek the advice of a professional financial adviser and carefully consider whether such investments are suitable for you in light of your own experience, financial position and investment objectives. The firm and its analysts do not have any material interests or conflicts of interest in any companies mentioned in this report.
Performance data provided is accurate and sourced from reliable platforms, including Argaam, Mordorintelligence, Saudi Chemical official disclosures, and financial reports.
IN NO EVENT SHALL SAHM CAPITAL FINANCIAL COMPANY BE LIABLE FOR ANY DAMAGES, LOSSES OR LIABILITIES INCLUDING WITHOUT LIMITATION, DIRECT OR INDIRECT, SPECIAL, INCIDENTAL, CONSEQUENTIAL DAMAGES, LOSSES OR LIABILITIES, IN CONNECTION WITH YOUR RELIANCE ON OR USE OR INABILITY TO USE THE INFORMATION PRESENTED ABOVE, EVEN IF YOU ADVISE US OF THE POSSIBILITY OF SUCH DAMAGES, LOSSES OR EXPENSES.