We Value Your Feedback! Help us shape better content and experiences by participating in our survey. Join the Survey Now!
Saudi Market
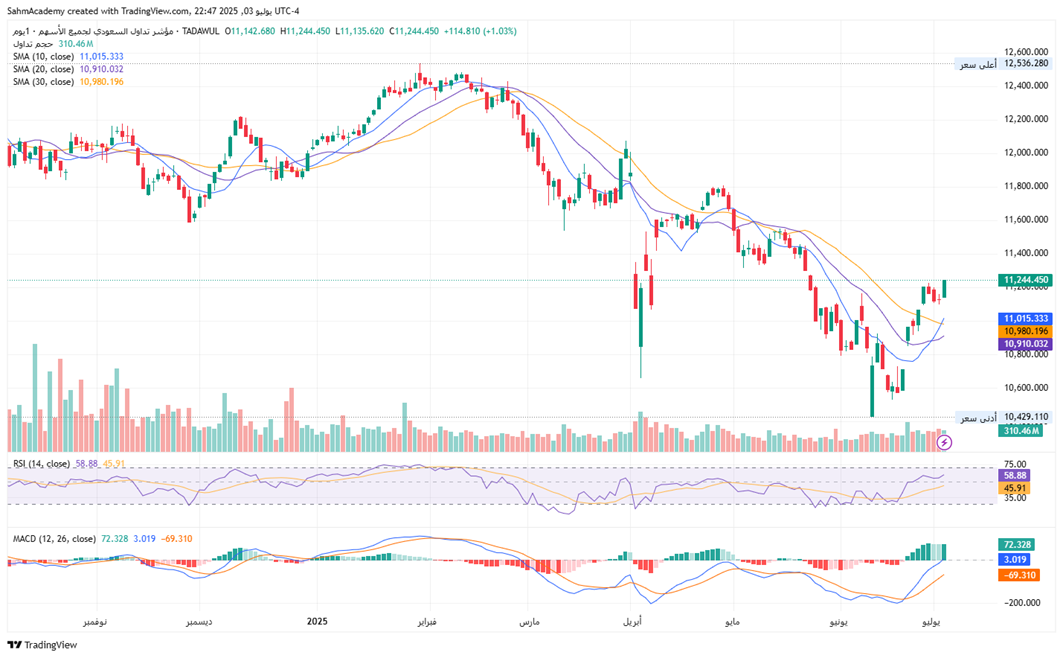
TASI Technical Analysis:
TASI currently exhibits a neutral-to-bullish technical stance, having rebounded 7.8% from June lows at 10,429 to the current level of 11,244.45. The index demonstrates positive momentum with price trading above all short-term moving averages, RSI at a healthy 58.88 level, and MACD showing bullish crossover signals. Key technical levels include critical resistance at 11,600-11,800 and major support at 10,800-11,000, with the index potentially forming a double bottom pattern supported by confirming volume. TASI stands at a pivotal technical juncture where a successful breakout above 11,800 with volume confirmation could trigger a significant trend reversal, while failure to breach key resistance may result in continued consolidation or retest of support levels. The recommendation is to employ conservative-to-moderate position sizing with stop-loss below 10,800 for long positions, as the index appears to be in a technical recovery phase that warrants cautious optimism with proper risk management.
TASI Index Weekly Market Summary (June 29 to July 3)
The TASI index increased by 0.37%. With a trading week of 5 days, the total trading volume reached 29 billion Saudi Riyals, averaging 5.8 billion per day.
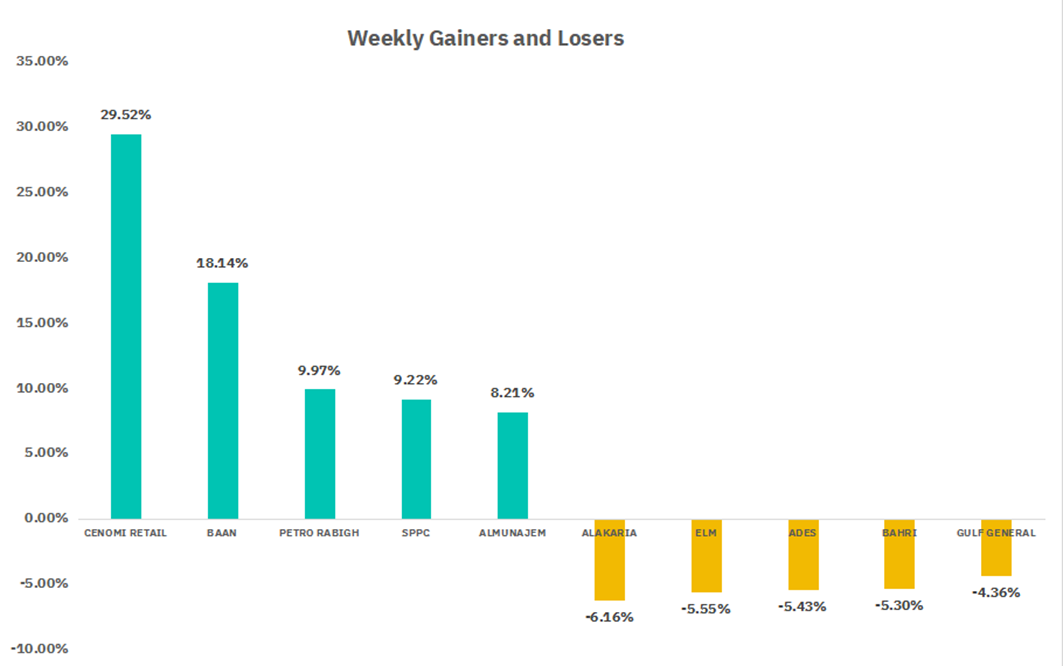
From the perspective of individual stock performance, 128 companies saw their stock prices rise this week, while 139 companies saw their stock prices fall. The companies with the highest increase included CENOMI RETAIL, BAAN, PETRO RABIGH, with increases of 29.52%, 18.14% , and 9.97% respectively. The companies with the highest decline included ALAKARIA, ELM, ADES , with declines of 6.16%, 5.55%, and 5.43% respectively.
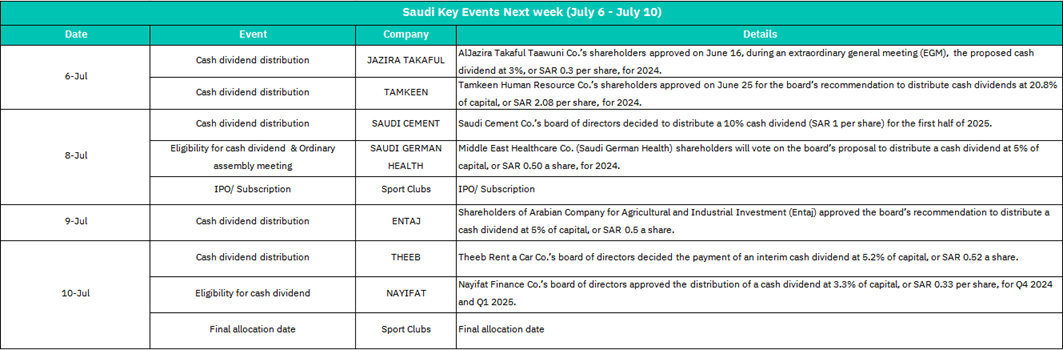
July 6:
Jazira Takaful
Cash dividend (3%, SAR 0.3/share) for 2024.
Short-term positive sentiment; may attract income-focused investors.
Tamkeen
Cash dividend (20.8%, SAR 2.08/share) for 2024.
High yield likely to boost investor interest; potential stock price support.
July 8:
Saudi Cement
H1 2025 cash dividend (10%, SAR 1/share).
Reinforces stability; cement sector benchmark.
Saudi German Health
Shareholder vote on 2024 dividend (5%, SAR 0.50/share).
Approval expected → short-term price support; rejection could trigger volatility.
Sport Clubs IPO Subscription
IPO opens.
May divert liquidity from other stocks; high retail interest likely.
July 9:
Entaj
Cash dividend (5%, SAR 0.5/share).
Neutral/mild positive; signals agri-industrial sector stability
July 10:
Theeb
Interim dividend (5.2%, SAR 0.52/share).
Positive for travel/rental sector sentiment.
Nayifat
Dividend for Q4 2024 & Q1 2025 (3.3%, SAR 0.33/share).
May lift finance sector stocks; yield appeals to conservative investors.
Sport Clubs IPO Final Allocation
IPO closes.
Post-allocation volatility possible; successful subscription could buoy broader market.
U.S. Market
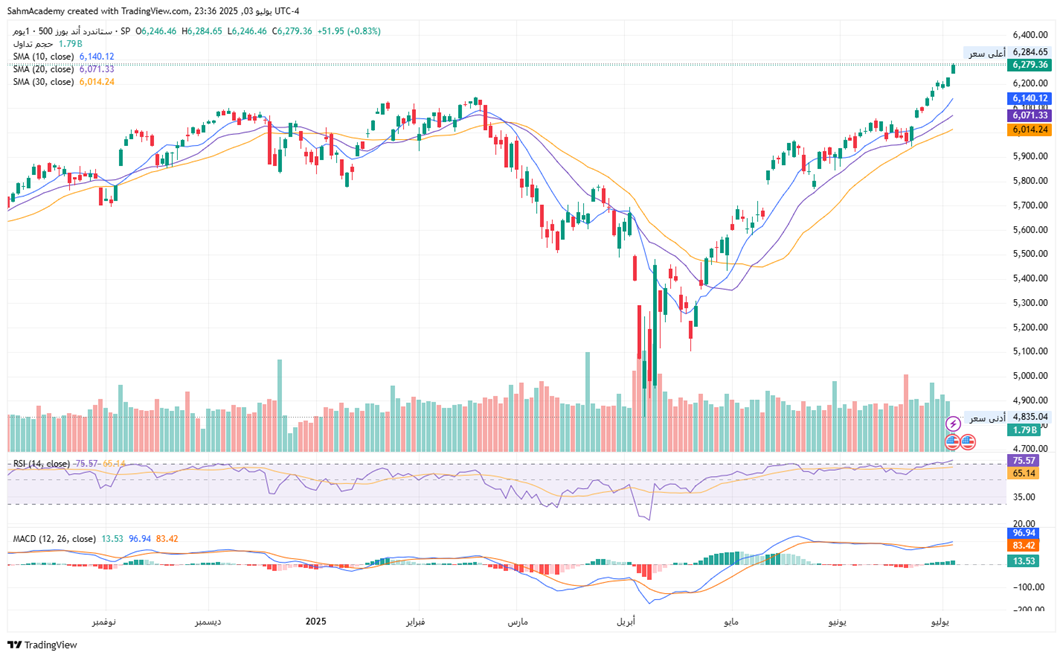
S&P500 Technical Analysis:
The S&P 500 demonstrates exceptionally strong bullish characteristics, trading at 6,279.36 near all-time highs of 6,284.65 with perfect moving average alignment (price above 10, 20, and 30-period SMAs at 6,140.12, 6,071.33, and 6,014.24 respectively). The index exhibits robust momentum with MACD showing strong bullish signals (13.53 above signal line 96.94 with positive histogram at 83.42), though RSI at 75.57 indicates overbought conditions without reaching extreme levels. Key technical levels include immediate support at 6,200-6,250 and major support at 6,100-6,150, while resistance targets extend to 6,300-6,350 and potentially 6,500+ on sustained momentum. The index has gained over 20% since April lows around 5,200, forming a healthy bull flag pattern near record highs with declining volume typical of consolidation phases.
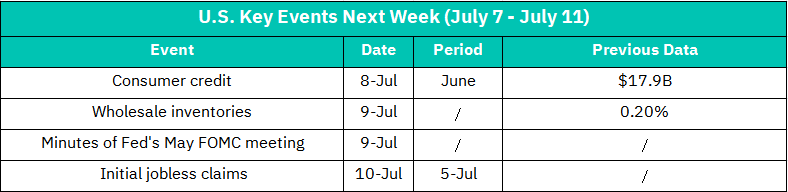
July 8: Consumer Credit (June)
Measures consumer debt growth (previous: $17.9B).
Above expectations: Signals resilient spending → bullish for consumer discretionary (AMZN, HD) but may reinforce "higher-for-longer" rate fears.
Below expectations: Suggests economic cooling → mixed reaction (dovish for bonds, bearish for retail stocks).
July 9:
Wholesale Inventories (Final, May)
Previous: +0.20% MoM.
Inventory buildup: May imply slowing demand → negative for industrials and retail.
Drawdown: Could signal restocking needs → short-term bullish.
FOMC Minutes (May Meeting)
Previous: -0.40%
Hawkish tone (inflation focus): Sell-off in rate-sensitive sectors (tech: NVDA, real estate: PLD).
Dovish hints (growth concerns): Rally in equities, especially small-caps (IWM).
Debate on 2025 rate cuts and balance sheet reduction.
July 10:
Initial Jobless Claims (Week Ending July 5)
Previous: 238K (consensus expects ~235K).
Claims > 245K: Labor weakness → boosts Fed cut bets → bullish for tech (AAPL) and bonds (TLT).
Claims < 230K: Labor resilience → extends equity volatility, favors value stocks (JPM).
Crypto ETF Technical Analysis:
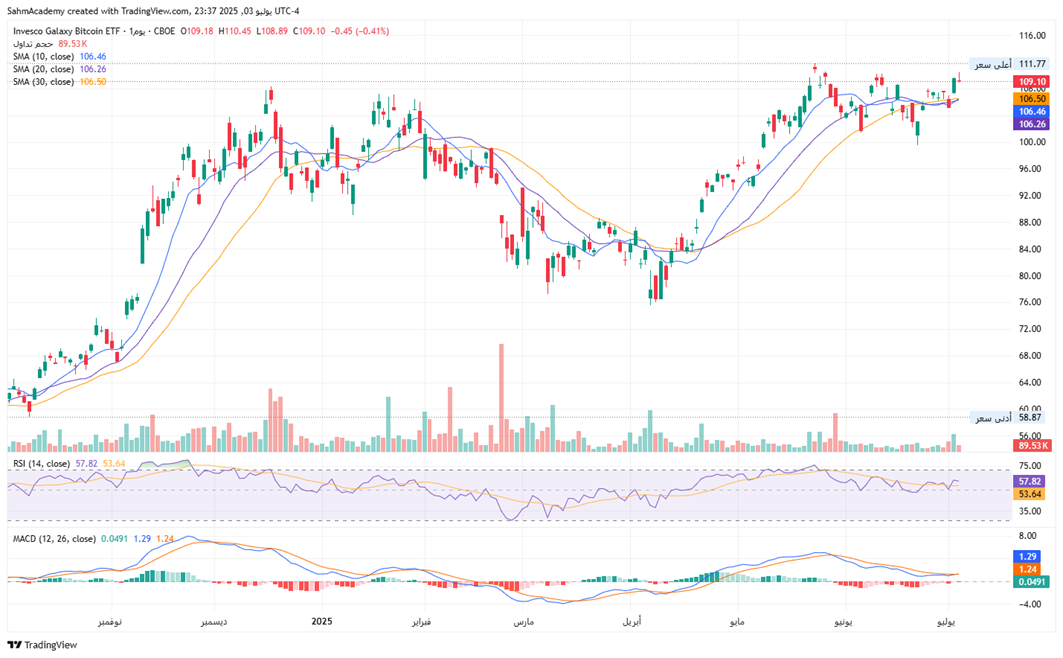
Based on Wall Street standard technical analysis, BTCO (Invesco Galaxy Bitcoin ETF) exhibits a neutral-to-bullish technical profile, currently trading at $109.10 near recent highs of $111.72 after a remarkable 43% recovery from March lows around $76. The ETF demonstrates strong technical foundation with price above all key moving averages (SMA 10: $106.46, SMA 20: $106.26, SMA 30: $106.50), RSI at a healthy 57.82 level providing room for upward momentum, and MACD showing positive momentum with a bullish histogram at 1.24. Key technical levels include immediate resistance at $110.00-$111.72 and major support at the SMA cluster around $106.00-$106.50, with potential cup-and-handle and bull flag formations suggesting continuation patterns. The ETF benefits from institutional-friendly Bitcoin exposure through SEC-approved structure while maintaining high correlation to underlying Bitcoin performance.
Disclaimer:
Sahm is subject to the supervision and control of the CMA, pursuant to its license no. 22251-25 issued by CMA.
The Information presented above is for information purposes only, which shall not be intended as and does not constitute an offer to sell or solicitation for an offer to buy any securities or financial instrument or any advice or recommendation with respect to such securities or other financial instruments or investments. When making a decision about your investments, you should seek the advice of a professional financial adviser and carefully consider whether such investments are suitable for you in light of your own experience, financial position and investment objectives. The firm and its analysts do not have any material interests or conflicts of interest in any companies mentioned in this report.
Performance data provided is accurate and sourced from reliable platforms, including Argaam, TradingView, MarketWatch.
IN NO EVENT SHALL SAHM CAPITAL FINANCIAL COMPANY BE LIABLE FOR ANY DAMAGES, LOSSES OR LIABILITIES INCLUDING WITHOUT LIMITATION, DIRECT OR INDIRECT, SPECIAL, INCIDENTAL, CONSEQUENTIAL DAMAGES, LOSSES OR LIABILITIES, IN CONNECTION WITH YOUR RELIANCE ON OR USE OR INABILITY TO USE THE INFORMATION PRESENTED ABOVE, EVEN IF YOU ADVISE US OF THE POSSIBILITY OF SUCH DAMAGES, LOSSES OR EXPENSES.