
Saudi Market
TASI Technical Analysis:
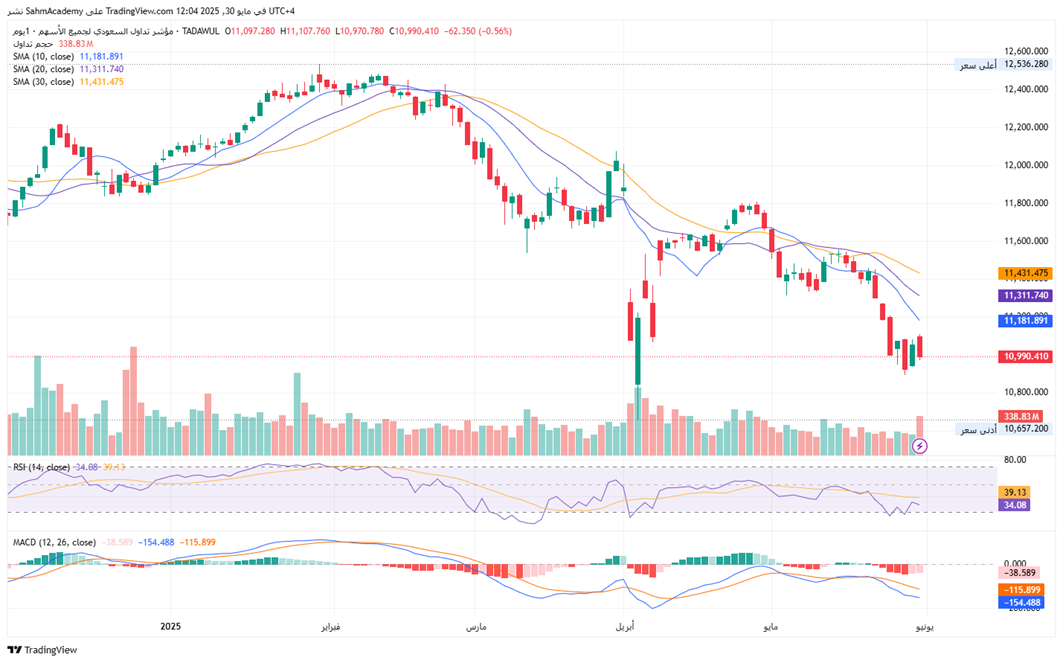
The TASI index exhibits entrenched bearish momentum, trading below all key moving averages (SMA 10/20/30 at 11,181.89/11,311.74/11,431.47) with expanding negative MACD (-154.488 vs -115.899 signal line) and elevated distribution volume (338.83M), confirming structural deterioration within its prevailing downtrend characterized by lower highs/lows since February 2024. Although the oversold RSI (34.08) suggests potential for a tactical bounce near critical support at 10,900-11,000, the predominant technical risk remains skewed downward (60% probability).
TASI Index Weekly Market Summary (May 25 to May 29)
The TASI index decreased by 0.09%. With a trading week of 5 days, the total trading volume reached 27 billion Saudi Riyals, averaging 5.5 billion per day.
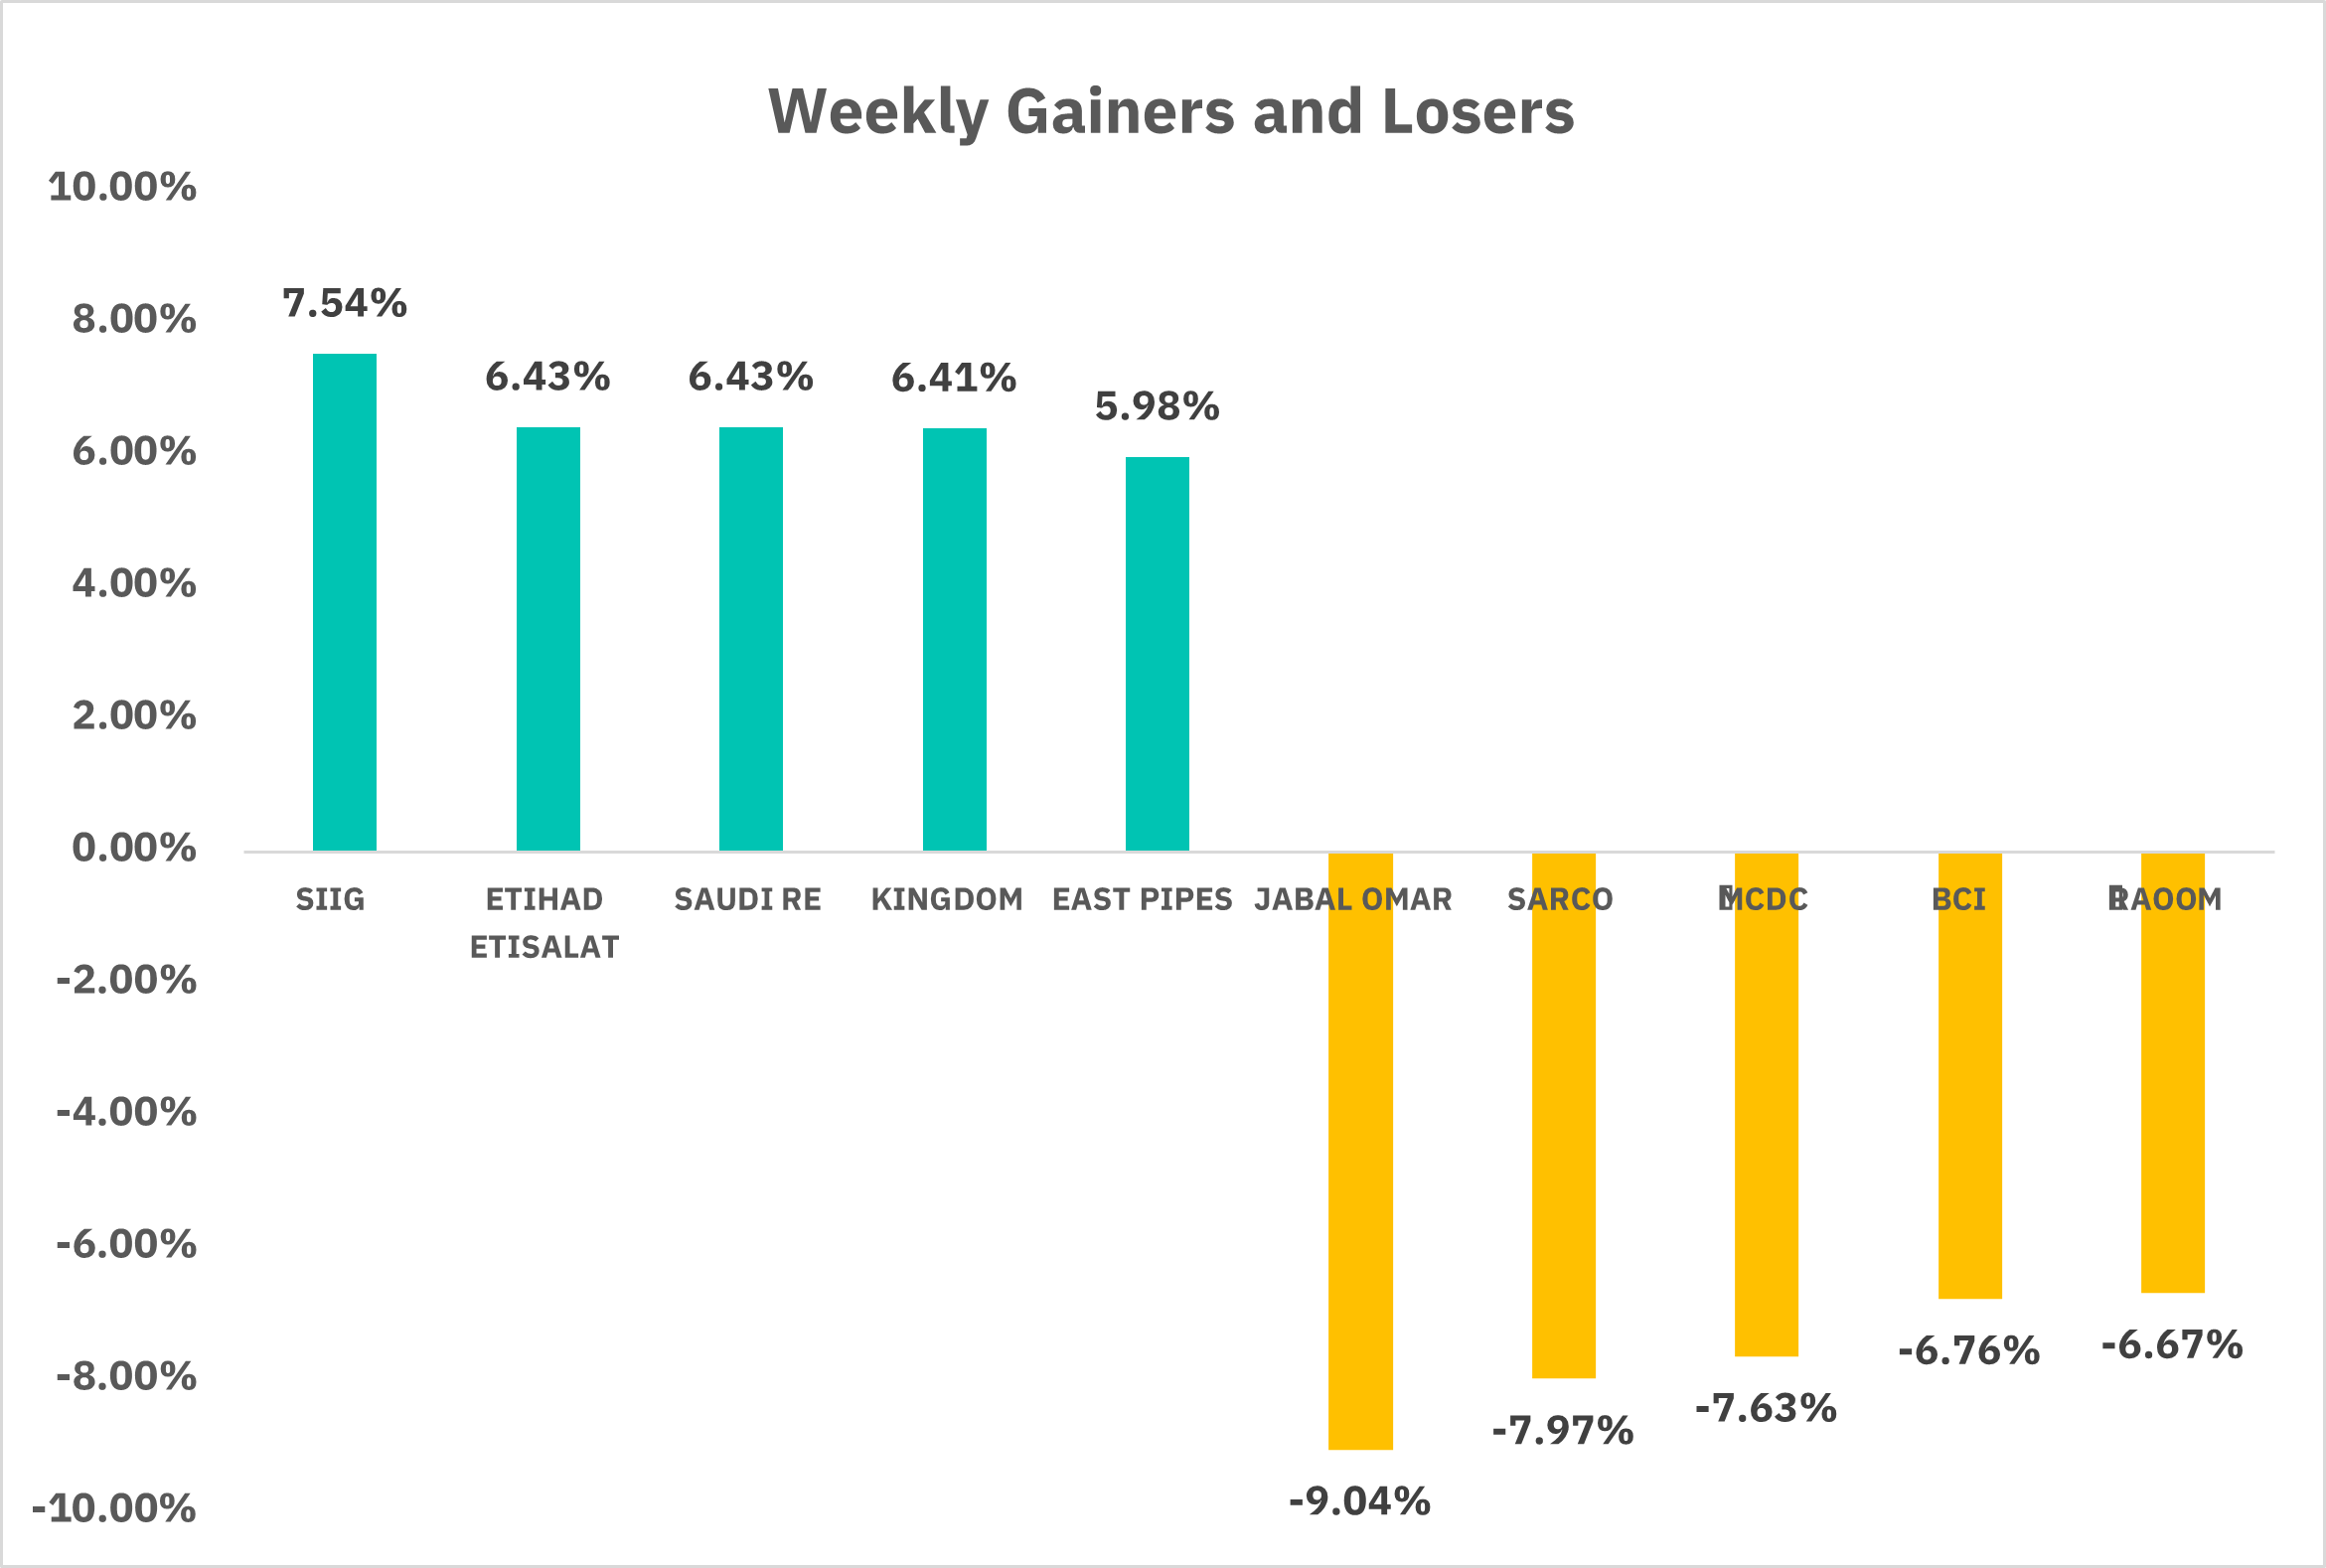
From the perspective of individual stock performance, 103 companies saw their stock prices rise this week, while 160 companies saw their stock prices fall. The companies with the highest increase included SIIG, ETIHAD ETISALAT, SAUDI RE, with increases of 7.54%, 6.43% , and 6.43% respectively. The companies with the highest decline included JABAL OMAR, SARCO, MCDC, with declines of 9.04%, 7.97%, and 7.63% respectively.
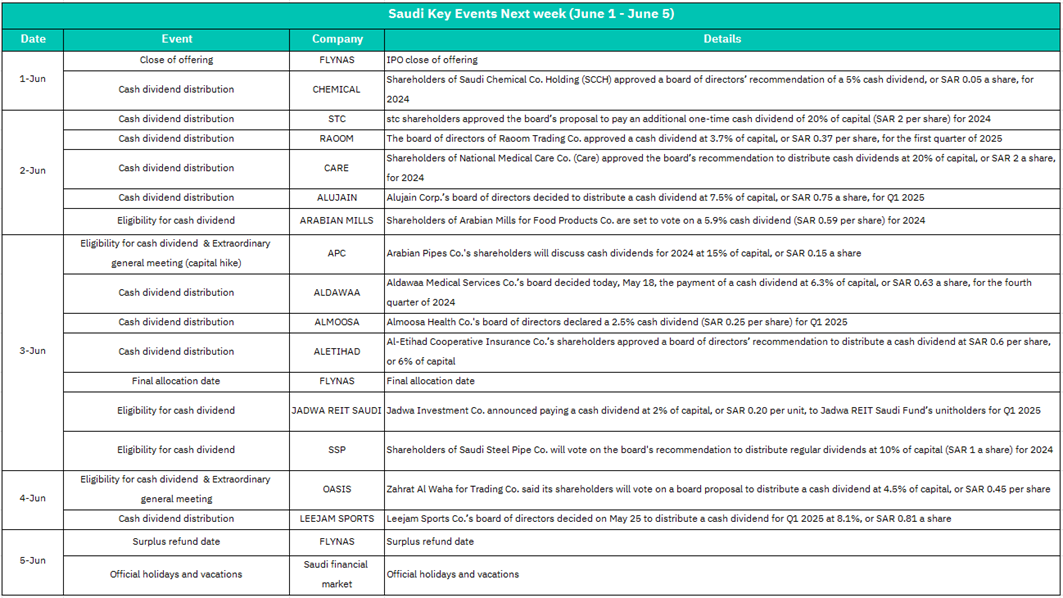
1. June 1
FLYNAS IPO Close: IPO subscription closes.
CHEMICAL Dividend: SAR 0.05/share (5% of capital) for 2024 distributed.
FLYNAS IPO closure may boost short-term liquidity interest. CHEMICAL’s dividend reinforces investor confidence in defensive sectors.
2. June 2
STC: Additional one-time dividend (SAR 2/share, 20% of capital).
RAOOM, CARE, ALUDAIN: Dividends distributed (3.7%, 20%, 7.5% of capital respectively).
ARABIAN MILLS: Shareholder vote on 5.9% dividend.
High dividend payouts (especially STC’s large one-time payment) may attract income-focused investors. Short-term price dips possible post-ex-dividend, but overall sentiment positive.
3. June 3
APC: Dividend eligibility (15% for 2024) + EGM for capital hike.
ALDAWAA, ALMOOSA, ALETIHAD: Dividends distributed (6.3%, 2.5%, 5% of capital).
JADWA REIT, SSP: Dividend eligibility votes.
FLYNAS: Final IPO allocation.
Focus on EGMs (e.g., APC’s capital hike proposal) may cause stock-specific volatility. REIT dividends (JADWA) could lift real estate sector. FLYNAS allocation may spur secondary market speculation.
4. June 4
OASIS: Dividend eligibility (4.5%) + EGM.
LEEJAM SPORTS: Dividend distribution (8.1% for Q1 2025).
EGMs could drive volatility if governance changes are proposed. Leejam’s robust dividend may boost consumer/leisure stocks.
5. June 5
FLYNAS: Surplus IPO refunds.
Market Holiday: Exchange closed.
FLYNAS refunds are procedural; unlikely to affect markets. Holiday may trigger pre-weekend profit-taking on June 4.
U.S. Market
S&P500 Technical Analysis:
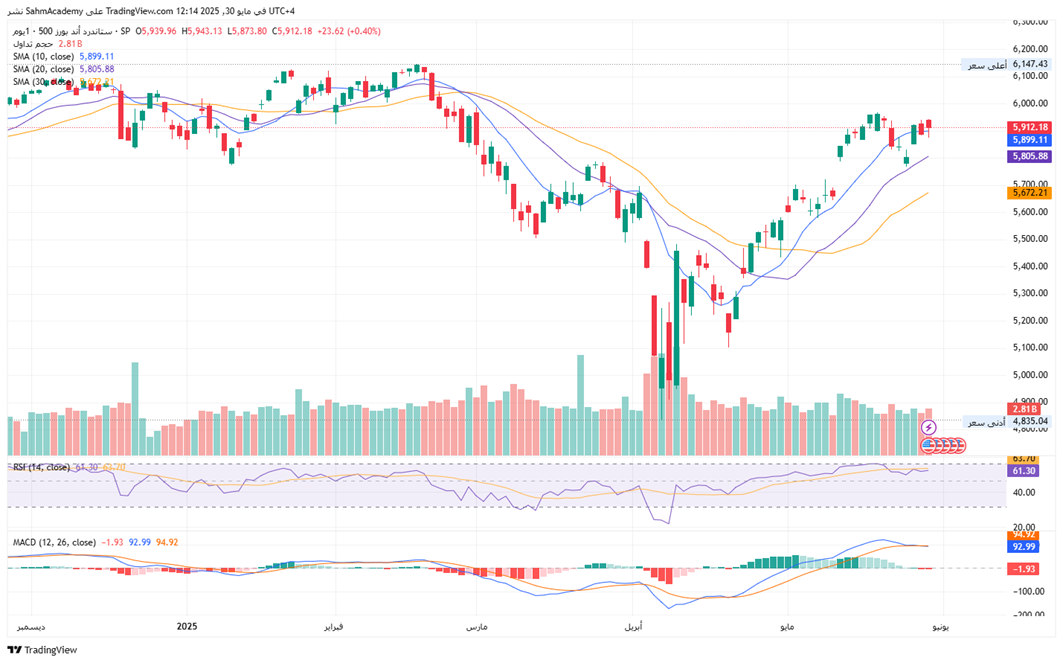
The S&P 500 maintains a robust bullish structure, trading above all key moving averages (SMA 10/20/30 at 5,899.11/5,805.88/5,672.21) with healthy RSI momentum (61.30) as it approaches all-time highs near 6,147.43, supported by a 16% advance from April lows that exhibits classic higher-highs/higher-lows formation. While minor MACD divergence (-1.93 histogram) signals potential near-term consolidation, the primary uptrend remains technically intact with critical support at 5,900 (SMA 10) and 5,800 (SMA 20).
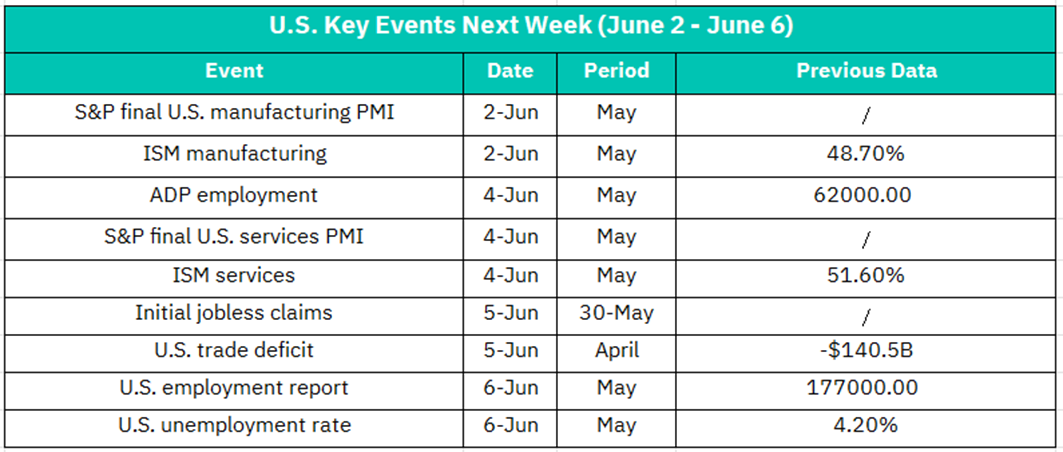
June 2
S&P U.S. Manufacturing PMI (May Final)
ISM Manufacturing (May):
Previous: 48.7% (contraction territory).
Focus on whether manufacturing remains below 50.0 (contraction). Weak data may amplify recession fears, pressuring industrials and cyclical stocks. A surprise rebound could boost sentiment.
June 4
ADP Employment (May): Previous: +62K jobs.
S&P U.S. Services PMI (May Final)
ISM Services (May): Previous: 51.6% (expansion).
ADP data sets expectations for Friday’s payrolls. Services PMI/ISM above 53.0 would signal resilience, supporting consumer and tech stocks. Weak ADP (<50K) may trigger bond rally, lifting growth stocks.
June 5
Initial Jobless Claims (Week ending May 30)
U.S. Trade Deficit (April): Previous: -$140.5B.
Impact: Jobless claims will fine-tune NFP forecasts. Sustained claims >220K could hint at labor softening. Trade deficit widening beyond -$145B may weigh on USD and exporters.
June 6
Nonfarm Payrolls (May): Previous: +177K jobs.
Unemployment Rate (May): Previous: 4.2%.
NFP >200K + unemployment ≤4.2%: Hawkish Fed fears resurface → sell-off in tech, utilities.
NFP <150K + unemployment >4.3%: Rate-cut bets surge → bonds rally, tech stocks rebound.
Goldilocks (170K–190K): Neutral reaction; sector rotation into cyclicals.
Crypto ETF Technical Analysis:
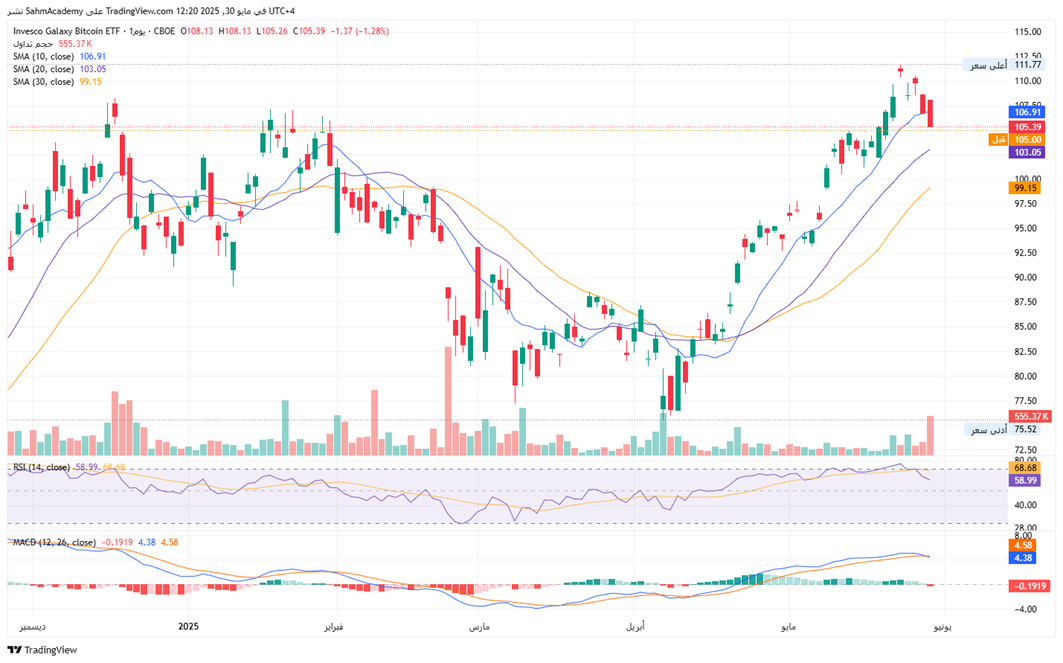
The BTCO Bitcoin ETF ($108.13) maintains a bullish technical structure, trading above all key moving averages (SMA 10/20/30 at $106.91/$103.05/$99.15) while completing a multi-month cup-and-handle pattern with measured targets at $118-125, supported by healthy RSI momentum (58.99) and 95%+ correlation to Bitcoin spot price. Despite minor MACD divergence (-0.19 histogram) indicating near-term consolidation, the setup favors upside resolution contingent on clearance of all-time high resistance at $111.77; critical support rests at $103 (SMA 20 confluence).
Disclaimer:
Sahm is subject to the supervision and control of the CMA, pursuant to its license no. 22251-25 issued by CMA.
The Information presented above is for information purposes only, which shall not be intended as and does not constitute an offer to sell or solicitation for an offer to buy any securities or financial instrument or any advice or recommendation with respect to such securities or other financial instruments or investments. When making a decision about your investments, you should seek the advice of a professional financial adviser and carefully consider whether such investments are suitable for you in light of your own experience, financial position and investment objectives. The firm and its analysts do not have any material interests or conflicts of interest in any companies mentioned in this report.
Performance data provided is accurate and sourced from reliable platforms, including Argaam, TradingView, MarketWatch.
IN NO EVENT SHALL SAHM CAPITAL FINANCIAL COMPANY BE LIABLE FOR ANY DAMAGES, LOSSES OR LIABILITIES INCLUDING WITHOUT LIMITATION, DIRECT OR INDIRECT, SPECIAL, INCIDENTAL, CONSEQUENTIAL DAMAGES, LOSSES OR LIABILITIES, IN CONNECTION WITH YOUR RELIANCE ON OR USE OR INABILITY TO USE THE INFORMATION PRESENTED ABOVE, EVEN IF YOU ADVISE US OF THE POSSIBILITY OF SUCH DAMAGES, LOSSES OR EXPENSES.
