We Value Your Feedback! Help us shape better content and experiences by participating in our survey. Join the Survey Now!
Saudi Market
TASI Technical Analysis:
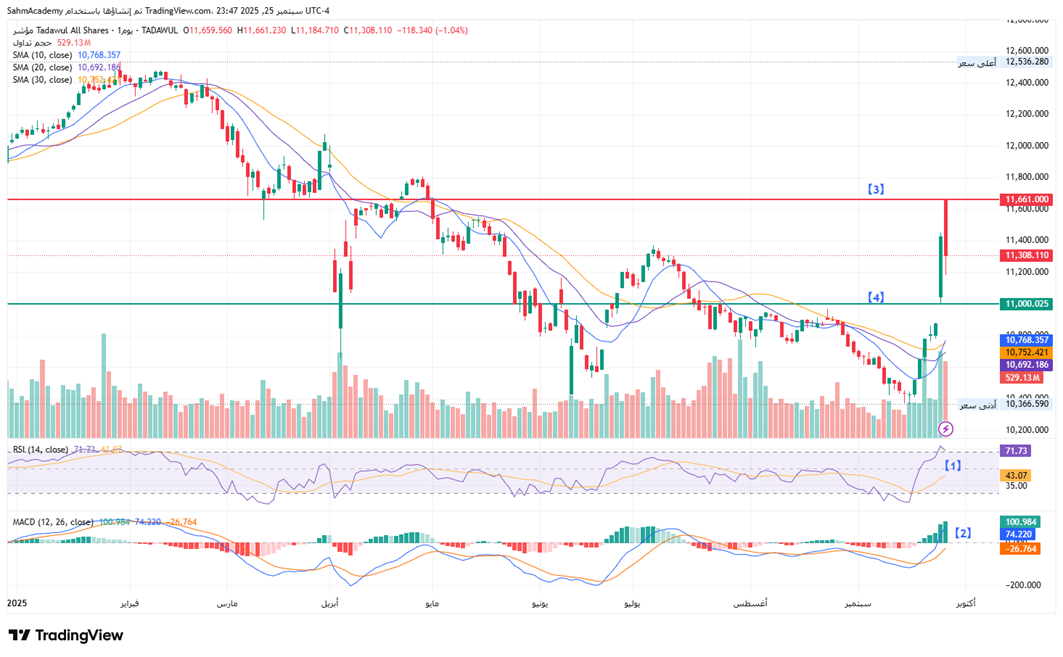
Looking at the TADAWUL All Shares Index (TASI) presents a compelling bullish breakout scenario. Currently trading at 11,308, TASI has surged approximately 9% from recent lows near 10,360, accompanied by robust volume expansion that validates the breakout. The price action shows a clear reversal pattern, with the index reclaiming all major moving averages - the 10-day SMA at 10,768, 20-day SMA at 10,692, and 30-day SMA at 10,752. This technical development suggests the seven-month corrective phase may be concluding, with momentum indicators supporting the bullish thesis.
[1] The RSI has strengthened to 71.73, approaching overbought territory but still within acceptable ranges for a trending market.
[2] MACD histogram shows strong positive divergence. The momentum indicators suggest sustained buying pressure, though some near-term consolidation around current levels would be healthy before the next leg higher.
[3] Key resistance levels to monitor include the psychological 11,500 level and the prior significant high around 11,661.
[4] A successful hold above the 11,000 support zone, which coincides with the broken downtrend line, would confirm the technical breakout and target a move toward the 12,000-12,200 resistance cluster. The volume profile supports this bullish outlook, with increased participation suggesting institutional accumulation during the recent consolidation phase.
TASI Index Weekly Market Summary (September 21 to September 25)
The TASI index increased by 4.62%. With a trading week of 4 days, the total trading volume reached 39 billion Saudi Riyals, averaging 9.8 billion per day.
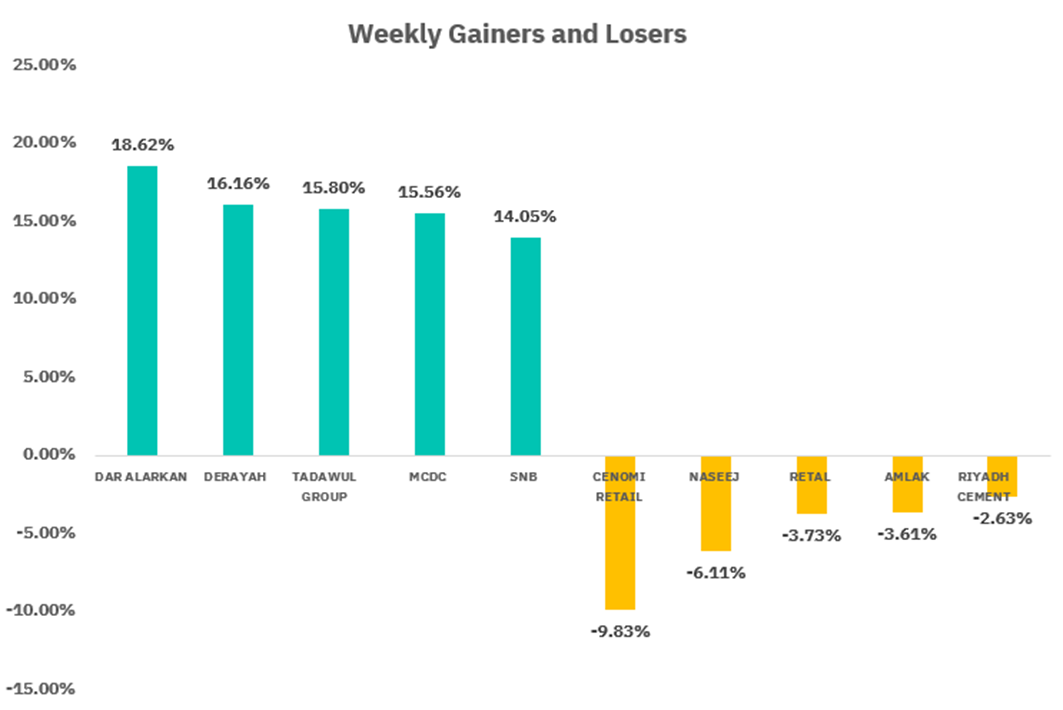
From the perspective of individual stock performance, 227 companies saw their stock prices rise this week, while 48 companies saw their stock prices fall. The companies with the highest increase included DAR ALARKAN, DERAYAH, TADAWUL GROUP, with increases of 18.62%, 16.16%, and 15.80% respectively. The companies with the highest decline included CENOMI RETAIL, NASEEJ, RETAL with declines of 9.83%, 6.11%, and 3.73% respectively.
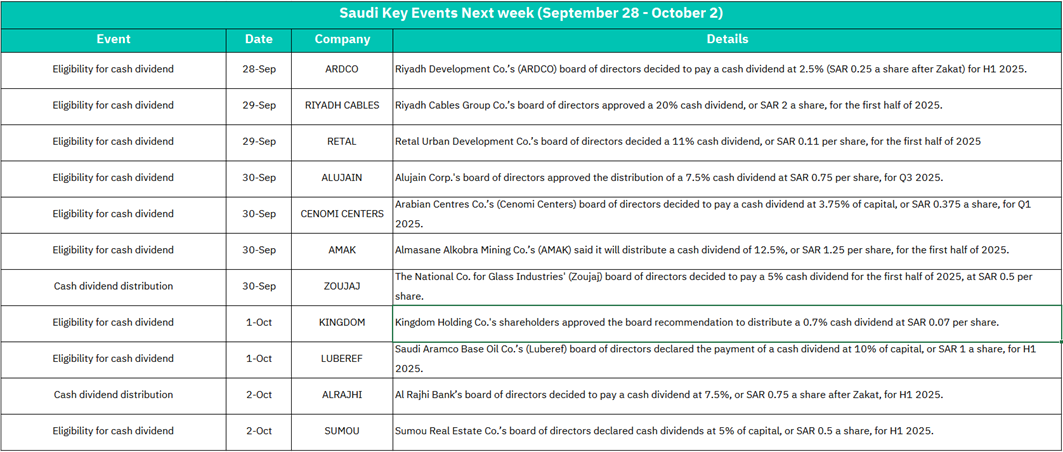
September 28:
ARDCO - Riyadh Development Co. board approved 2.5% cash dividend (SAR 0.25 per share after Zakat) for H1 2025
Market Impact:
The dividend announcement from ARDCO should provide positive momentum for the real estate development sector. A 2.5% dividend yield is attractive in the current market environment and may attract income-focused investors. This could lead to increased trading volume and potential price appreciation for ARDCO shares, with possible spillover effects to other real estate developers in the Saudi market.
September 29:
RIYADH CABLES - Board approved 20% cash dividend (SAR 2 per share) for H1 2025
RETAL - Retal Urban Development Co. declared 11% cash dividend (SAR 0.11 per share) for H1 2025
Market Impact: Both dividend announcements signal strong financial health in the infrastructure and urban development sectors. RIYADH CABLES' substantial 20% dividend (SAR 2 per share) is particularly noteworthy and should generate significant investor interest in utility and cable sector stocks. The combined effect of two dividend announcements may create broader market optimism and support the Tadawul's performance, especially benefiting dividend-focused ETFs and mutual funds.
September 30:
ALUJAIN - Board approved 7.5% cash dividend (SAR 0.75 per share) for Q3 2025
CENOMI CENTERS - Arabian Centres Co. declared 3.75% dividend (SAR 0.375 per share) for Q1 2025
AMAK - Almasakin AlAhlia Mining Co. announced 12.5% cash dividend (SAR 1.25 per share) for H1 2025
ZOUAJ - National Co. for Glass Industries board decided on 5% cash dividend (SAR 0.5 per share) for H1 2025 (Distribution date)
Market Impact:
Monday presents the heaviest concentration of dividend-related activities, spanning multiple sectors including construction materials (ALUJAIN), retail real estate (CENOMI CENTERS), mining (AMAK), and industrial manufacturing (ZOUAJ). This diversified dividend activity should create broad-based market support and increased liquidity. The mining sector dividend from AMAK may particularly attract attention given the Kingdom's focus on mining diversification under Vision 2030.
October 1:
KINGDOM - Kingdom Holding Co. shareholders approved 0.7% cash dividend (SAR 0.07 per share)
LUBEREF - Saudi Aramco Base Oil Co. board declared 10% dividend (SAR 1 per share) for H1 2025
Market Impact: KINGDOM's dividend approval adds stability to the investment holding sector, while LUBEREF's 10% dividend highlights the strength in petrochemical and oil-related industries. LUBEREF's dividend is particularly significant as it reflects Aramco's downstream operations performance. These announcements should support energy and investment sector indices, with potential positive sentiment spillover to other Aramco-related subsidiaries.
October 2:
ALRAJHI - Al Rajhi Bank decided on 7.5% cash dividend (SAR 0.75 per share after Zakat) for H1 2025 (Distribution date)
SUMOU - Sumou Real Estate Co. declared 5% cash dividend (SAR 0.5 per share) for H1 2025
Market Impact: Al Rajhi Bank's dividend distribution marks a significant event given its weight in the Tadawul All Share Index and the banking sector index. As one of the largest Islamic banks globally, ALRAJHI's dividend should strengthen the financial sector's performance and may trigger increased foreign institutional interest. SUMOU's dividend adds to the week's real estate sector strength, potentially supporting the broader real estate investment theme.
U.S. Market
S&P500 Technical Analysis:
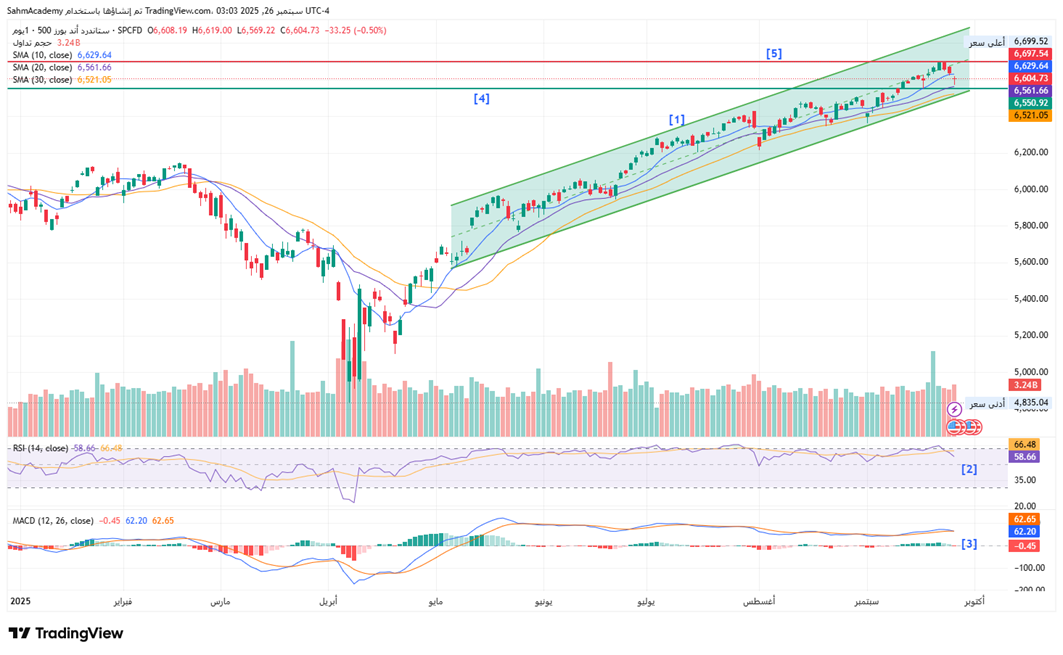
The S&P 500 Index continues to demonstrate remarkable technical strength. [1]The price action showing a textbook ascending channel pattern. All major moving averages remain in bullish alignment, with the 10-day SMA at 6,629, 20-day SMA at 6,561, and 30-day SMA at 6,521 providing successive layers of dynamic support. The recent pullback from the October highs near 6,700 appears to be a healthy consolidation within the broader uptrend, with the index finding support above the key 6,520-6,560 zone. Volume patterns suggest institutional participation remains robust, though the recent decline shows some distribution characteristics that warrant monitoring.
[2] The RSI at 58.66 has pulled back from overbought levels above 70, creating room for renewed upside momentum while avoiding extreme readings that typically precede deeper corrections.
[3] MACD remains constructive with the histogram showing only minor negative divergence.
[4] Key support levels include the 6,550.
[5] Resistance remains at the recent highs near 6,697, with a breakout above this level likely to accelerate toward the 6,800-6,900 target zone.
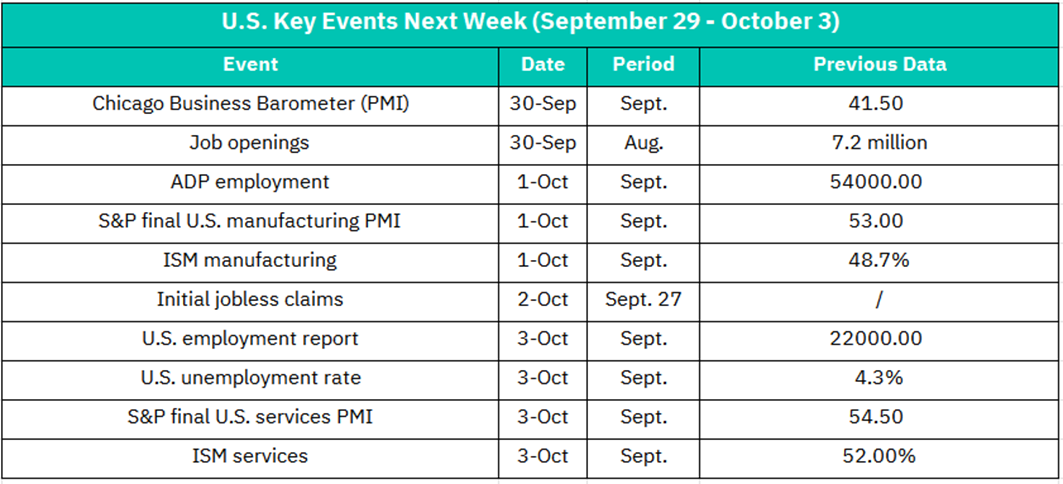
September 30:
Chicago Business Barometer (PMI) - September data (Previous: 41.50)
Job Openings (JOLTS) - August data (Previous: 7.2 million)
Market Impact:
The Chicago PMI will provide early insights into manufacturing sentiment for September, with the previous reading of 41.5 indicating contraction (below 50). Any improvement toward the 50 threshold could boost manufacturing and industrial stocks. The JOLTS data will be crucial for assessing labor market tightness ahead of Friday's employment report. A decline from 7.2 million openings could signal labor market cooling, potentially supporting the Fed's dovish stance and benefiting growth stocks. Conversely, sustained high job openings might reinforce inflation concerns.
October 1:
ADP Employment Report - September data (Previous: 540,000)
S&P Final U.S. Manufacturing PMI - September data (Previous: 53.0)
ISM Manufacturing Index - September data (Previous: 48.7%)
Market Impact:
This is a critical day for manufacturing and employment data. The ADP report serves as a preview for Friday's NFP, with the previous 540K reading being exceptionally strong. A significant deviation could set market expectations for the official jobs report. The ISM Manufacturing reading is key - the previous 48.7% indicated contraction, and any move above 50 would signal expansion, likely boosting industrial and cyclical stocks. The S&P PMI final reading should confirm preliminary manufacturing trends. Manufacturing-heavy sectors like industrials, materials, and technology hardware could see significant volatility.
October 2:
Initial Jobless Claims
Market Impact:
Weekly jobless claims provide the most timely labor market indicator and will be closely watched ahead of Friday's employment report. Claims trends help gauge labor market momentum and Fed policy implications. A significant increase could support expectations for continued Fed accommodation, benefiting growth stocks and rate-sensitive sectors like technology and real estate. Lower claims would reinforce labor market strength, potentially pressuring bonds and supporting value stocks. This data point often drives intraday volatility across all major indices.
October 3:
U.S. Employment Report - September data (Previous: 220,000 jobs added)
U.S. Unemployment Rate - September data (Previous: 4.3%)
S&P Final U.S. Services PMI - September data (Previous: 54.50)
ISM Services Index - September data (Previous: 52.0%)
Market Impact:
The employment report is the week's most significant event. With 220K jobs added previously and 4.3% unemployment, any substantial deviation will drive major market moves. A strong jobs report could reignite inflation concerns and hawkish Fed expectations, potentially pressuring growth stocks while supporting financials and value plays. Weak employment data might boost expectations for aggressive Fed easing, benefiting duration-sensitive assets.
The services PMI and ISM data are equally important given services represent ~70% of the U.S. economy. The previous readings (54.5% S&P, 52.0% ISM) both indicated expansion. Any weakening could raise recession concerns, while strength would support economic resilience narratives. Expect significant volatility across all sectors, with particular impact on:
• Technology: Sensitive to rate expectations
• Financials: Benefit from strong economy but hurt by dovish Fed pivot
• Consumer Discretionary: Dependent on employment trends
• Utilities/REITs: Inverse correlation with rate expectations
Crypto ETF Technical Analysis:
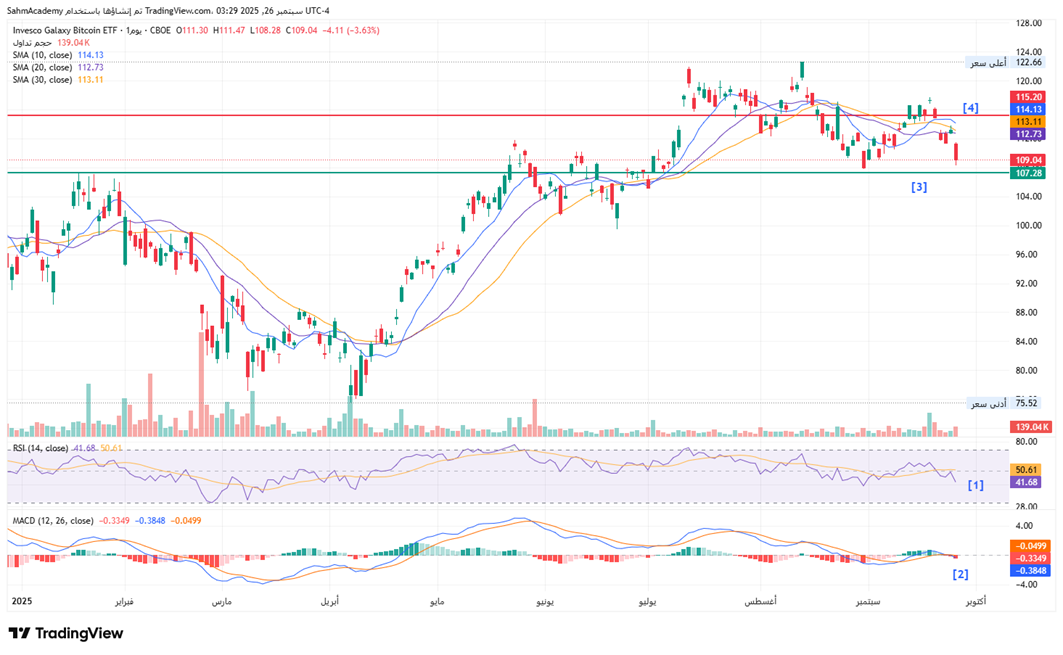
BTCO is exhibiting classic consolidation characteristics. Currently trading at 109.04, the ETF has established a well-defined sideways trading range between 108-122 over the past three months, with the moving averages converging in a tight cluster - the 10-day SMA at 114.13, 20-day SMA at 112.73, and 30-day SMA at 113.11. This convergence typically precedes a significant directional move, and the recent price action suggests the ETF is testing the lower boundary of this consolidation zone.
[1] From a momentum standpoint, the technical indicators are signaling potential weakness in the near term. The RSI has declined to 41.68, approaching oversold territory and suggesting the selling pressure may be nearing exhaustion.
[2] MACD histogram remains negative at -0.3349, indicating that downside momentum could persist in the short term.
[3] Key support levels is around $107, [4] while resistance remains at the $115 zone where the moving averages are clustered. A decisive break below $108 could accelerate selling toward the $100-102 area, potentially retesting the significant March lows.
Disclaimer:
Sahm is subject to the supervision and control of the CMA, pursuant to its license no. 22251-25 issued by CMA.
The Information presented above is for information purposes only, which shall not be intended as and does not constitute an offer to sell or solicitation for an offer to buy any securities or financial instrument or any advice or recommendation with respect to such securities or other financial instruments or investments. When making a decision about your investments, you should seek the advice of a professional financial adviser and carefully consider whether such investments are suitable for you in light of your own experience, financial position and investment objectives. The firm and its analysts do not have any material interests or conflicts of interest in any companies mentioned in this report.
Performance data provided is accurate and sourced from reliable platforms, including Argaam, TradingView, MarketWatch.
IN NO EVENT SHALL SAHM CAPITAL FINANCIAL COMPANY BE LIABLE FOR ANY DAMAGES, LOSSES OR LIABILITIES INCLUDING WITHOUT LIMITATION, DIRECT OR INDIRECT, SPECIAL, INCIDENTAL, CONSEQUENTIAL DAMAGES, LOSSES OR LIABILITIES, IN CONNECTION WITH YOUR RELIANCE ON OR USE OR INABILITY TO USE THE INFORMATION PRESENTED ABOVE, EVEN IF YOU ADVISE US OF THE POSSIBILITY OF SUCH DAMAGES, LOSSES OR EXPENSES.