We Value Your Feedback! Help us shape better content and experiences by participating in our survey. Join the Survey Now!
Saudi Market
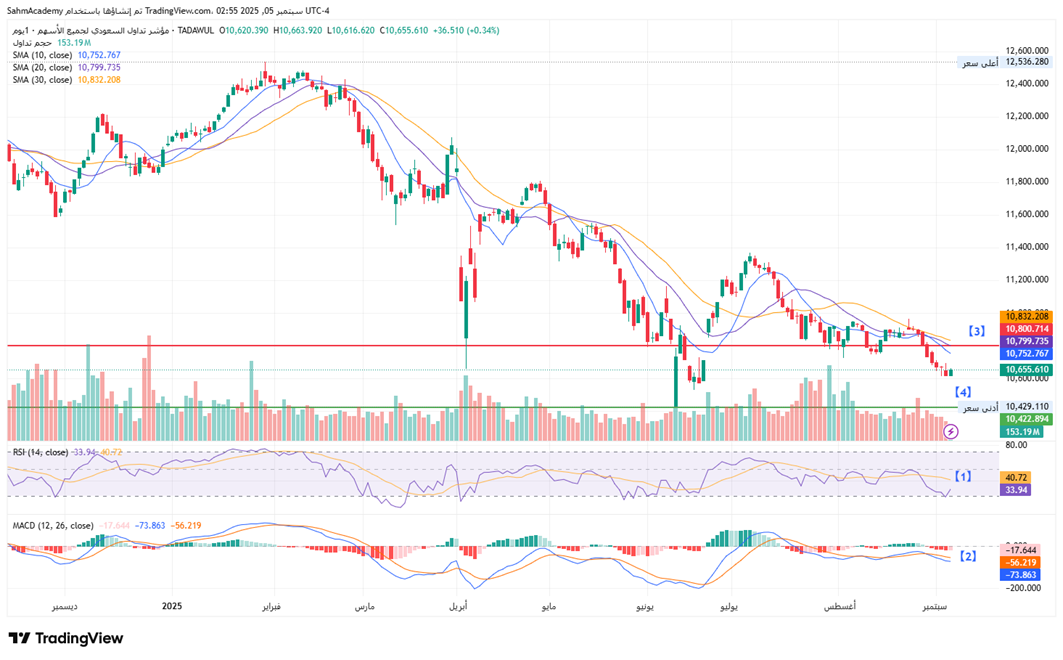
TASI Technical Analysis:
TASI index has established a consistent pattern of lower highs and lower lows, with the current price at 10,655 representing a significant decline of approximately 14% from the yearly high. The moving average structure confirms this bearish bias, with the 10-day SMA (10,752) below the 20-day SMA (10,799), which in turn sits below the 30-day SMA (10,852), creating a classic bearish moving average alignment. The recent price action shows the index struggling to maintain support above the 10,600 level, and the declining volume pattern suggests waning buying interest during bounce attempts.
[1] The momentum indicators provide additional confirmation of the bearish sentiment. The RSI at 33.94 indicates oversold conditions but hasn't yet shown signs of bullish divergence, suggesting further downside potential remains.
[2] The MACD histogram at -73.863 reflects strong bearish momentum, though the indicator appears to be approaching potential stabilization levels that could signal a near-term bounce.
[3] Key resistance levels are now established at around 10,800.
[4] While immediate support lies at the recent low near 10,422.
Given the technical structure, any recovery attempts are likely to face significant resistance at previous support levels, and a break below 10,400 could accelerate the decline toward the 10,000.
TASI Index Weekly Market Summary (August 31 to September 4)
The TASI index decreased by 0.39%. With a trading week of 5 days, the total trading volume reached 17 billion Saudi Riyals, averaging 3.5 billion per day.
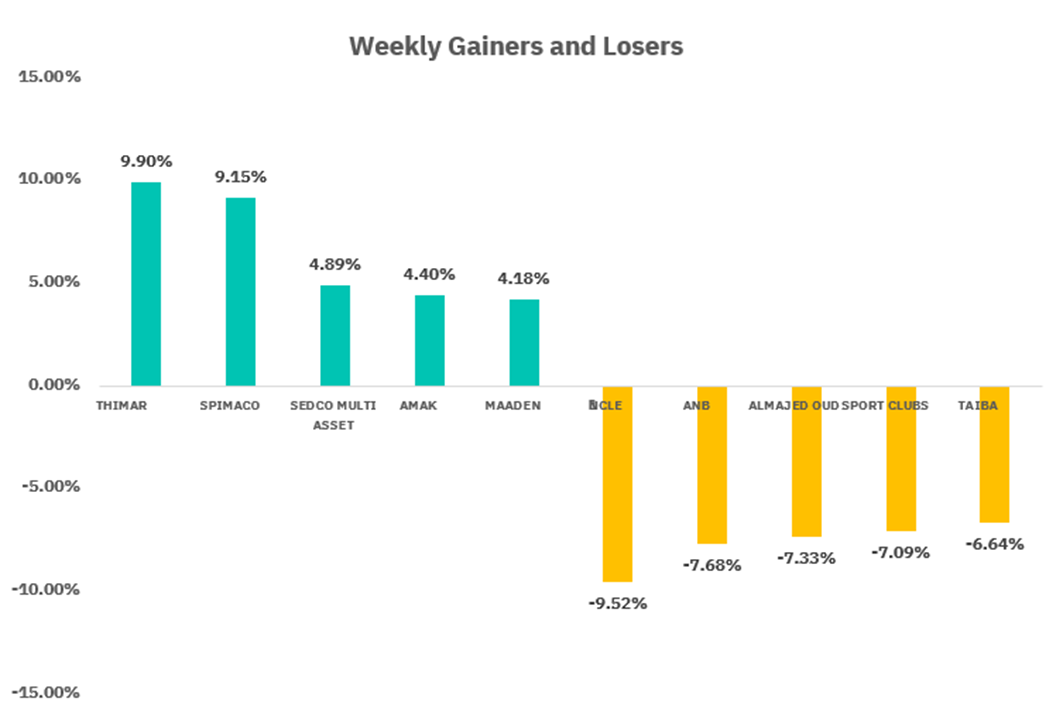
From the perspective of individual stock performance, 79 companies saw their stock prices rise this week, while 193 companies saw their stock prices fall. The companies with the highest increase included THIMAR, SPIMACO , SEDCO MULTI ASSET , with increases of 9.90%, 9.15%, and 4.89% respectively. The companies with the highest decline included NCLE, ANB, ALMAJED OUD with declines of 9.52%, 7.68 %, and 7.33% respectively.
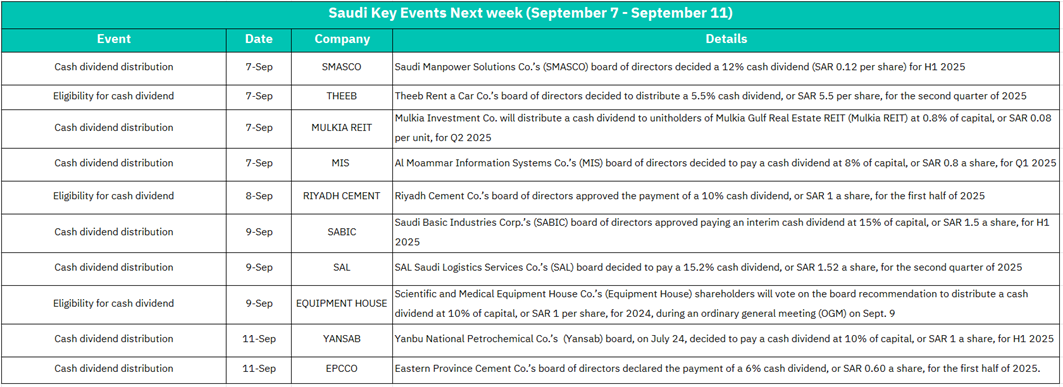
September 7 :
SMASCO: 12% cash dividend distribution (SAR 0.12 per share) for H1 2025
THEEB: Eligibility for 5.5% cash dividend (SAR 5.5 per share) for Q2 2025
MULKIA REIT: Cash dividend distribution at 0.8% of capital (SAR 0.08 per unit) for Q2 2025
MIS: 8% cash dividend distribution (SAR 0.8 per share) for Q1 2025
Market Impact:
Heavy dividend distribution day may create selling pressure as stocks typically go ex-dividend
THEEB likely to see significant price adjustment due to high SAR 5.5 dividend per share
REIT sector (MULKIA) may attract income-focused investors
Overall market liquidity expected to increase from dividend cash flows
September 8:
RIYADH CEMENT: Eligibility for 10% cash dividend (SAR 1 per share) for H1 2025
Market Impact:
Cement sector focus with substantial 10% dividend yield
May drive interest in construction/infrastructure-related stocks
Relatively lighter trading day with single major corporate action
Potential support for building materials sector sentiment
September 9:
SABIC: 15% interim cash dividend distribution (SAR 1.5 per share) for H1 2025
SAL: 15.2% cash dividend distribution (SAR 1.52 per share) for Q2 2025
EQUIPMENT HOUSE: Shareholder voting on 10% dividend recommendation (SAR 1 per share) for 2024
Market Impact:
Major market moving day with SABIC's large 15% dividend (blue-chip petrochemical giant)
SAL's 15.2% dividend (highest yield of the week) may create significant price volatility
Petrochemical sector expected to lead market activity
Equipment House voting adds uncertainty element - outcome will affect stock direction
High trading volumes anticipated across multiple sectors
September 11:
YANSAB: 10% cash dividend distribution (SAR 1 per share) for H1 2025
EPCCO: 6% cash dividend distribution (SAR 0.60 per share) for H1 2025
Market Impact:
Petrochemical sector continues momentum with YANSAB dividend
Cement sector represented again with EPCCO
Mid-week profit-taking may occur as dividend capture strategies conclude
Lower overall market impact compared to Monday's events
Consolidation phase expected as major dividend events wind down
U.S. Market
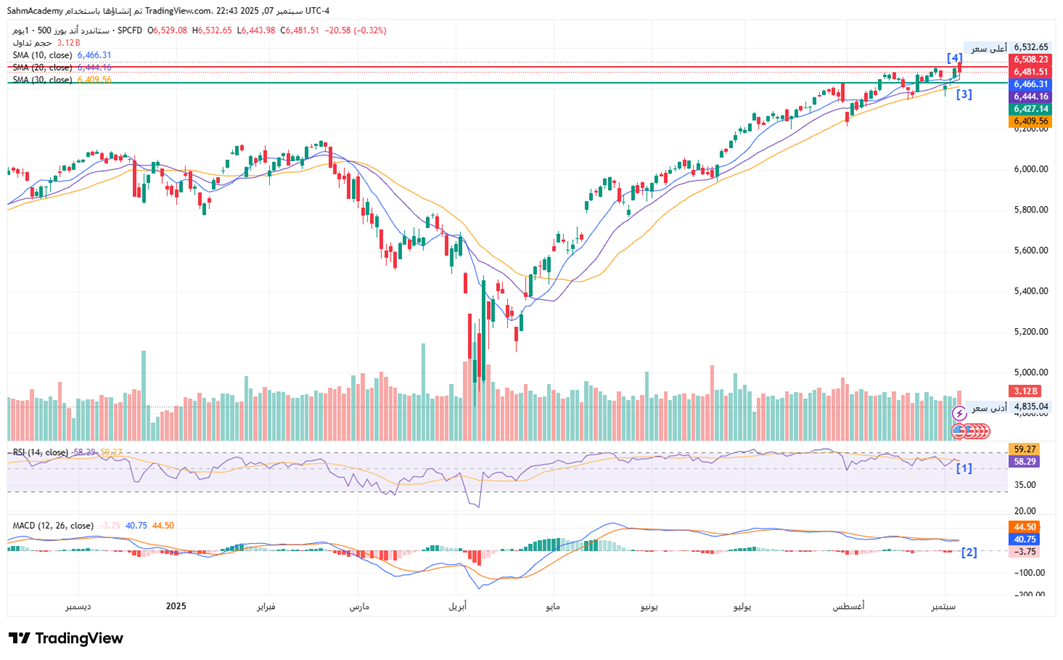
S&P500 Technical Analysis:
The S&P 500 Index presents a compelling bullish technical structure, having demonstrated remarkable resilience throughout 2025 with a strong uptrend that has propelled the index from the March lows around 5,100 to current levels near 6,502. The index has established a well-defined ascending channel, with the price consistently respecting both the rising trendline support and making successive higher highs and higher lows. The moving average configuration is decidedly bullish, with the 10-day SMA (6,455) positioned above the 20-day SMA (6,437), which in turn sits above the 30-day SMA (6,405), creating a perfect bullish alignment.
[1] The momentum indicators provide a mixed but generally constructive outlook for continued upside potential. The RSI at 61.05 remains in healthy bullish territory, well above the 50 midline but not yet reaching overbought extremes above 70, indicating room for further gains.
[2] The MACD at 41.37 shows positive momentum, though the histogram appears to be flattening slightly, suggesting the pace of gains may moderate in the near term. Volume patterns have been relatively stable, supporting the authenticity of the price advance.
[3] Key support levels are established at around 6,437.
[4] Resistance lies at the recent highs near 6,508.
The technical picture suggests the SPX remains in a strong primary uptrend, though some consolidation or minor pullback toward the 6,400-6,450 support zone would be healthy before the next leg higher toward the 6,600 target level.
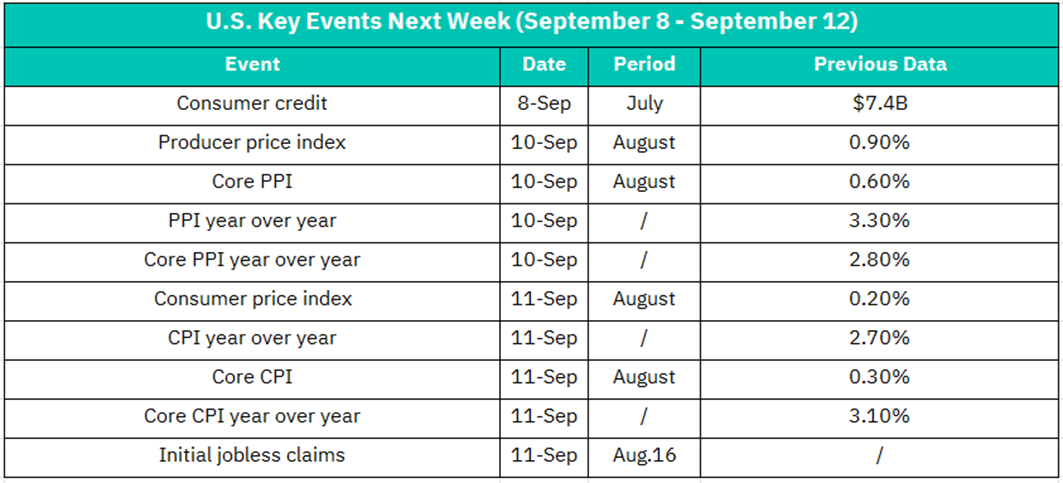
September 8:
Consumer Credit (July): Previous data showed $7.4B
Market Impact:
Consumer credit data provides insight into household spending capacity and economic health
Previous $7.4B suggests moderate credit expansion
If current data shows acceleration, could signal stronger consumer demand ahead
Moderate market impact as consumer credit is a lagging indicator
May influence consumer discretionary and financial sector stocks
September 10:
Producer Price Index (August): Previous 0.90% monthly reading
Core PPI (August): Previous 0.60% monthly reading
PPI Year-over-Year: Previous 3.30% annual rate
Core PPI Year-over-Year: Previous 2.80% annual rate
Market Impact:
CRITICAL INFLATION DAY - PPI data directly impacts Fed policy expectations
Previous 0.90% monthly PPI was elevated; any acceleration could trigger hawkish Fed concerns
Core PPI (excluding food/energy) more closely watched by Fed - 0.60% was already high
Annual rates above 3% suggest persistent wholesale price pressures
High volatility expected across all sectors, particularly:
• Bond markets: Yields may spike if data runs hot
• Growth stocks: Sensitive to interest rate expectations
• Dollar strength: Hot inflation typically strengthens USD
September 11:
Consumer Price Index (August): Previous 0.20% monthly reading
Core CPI (August): Previous 0.30% monthly reading
CPI Year-over-Year: Previous 2.70% annual rate
Core CPI Year-over-Year: Previous 3.10% annual rate
Initial Jobless Claims (Aug 16 week): Fresh employment data
Market Impact:
MOST CRITICAL DAY OF THE WEEK - CPI is the Fed's primary inflation gauge
Previous 0.20% monthly CPI was relatively benign, but core CPI at 0.30% was concerning
Core CPI YoY at 3.10% remains well above Fed's 2% target
Market expectations likely pricing in continued disinflation - any surprises could cause major moves:
• Higher than expected: Risk-off sentiment, growth stocks selloff, rate cut expectations reduced
• Lower than expected: Rally in equities, bonds, rate cut hopes increase
Jobless claims add employment context to Fed decision-making
Sector impacts:
• Technology: Highly sensitive to rate expectations
• Real Estate: REITs vulnerable to rate concerns
• Financials: Banks may benefit from higher rate expectations
Crypto ETF Technical Analysis:
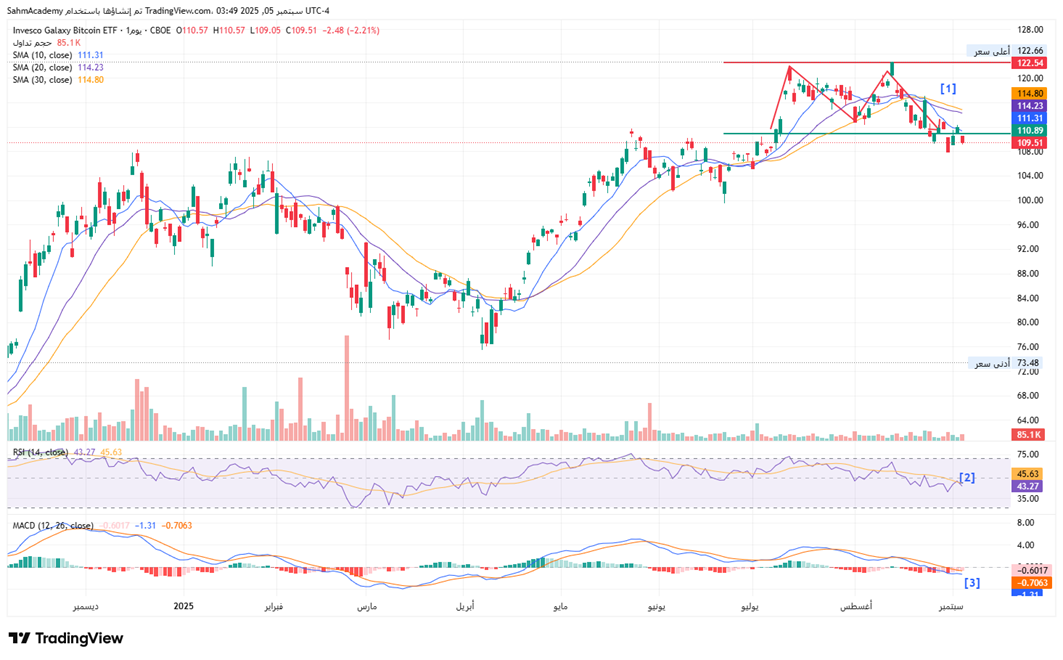
The Invesco Galaxy Bitcoin ETF (BTCO) exhibits a deteriorating technical profile. [1]The ETF has formed a clear double-top pattern with peaks around 122, followed by a breakdown below key support levels. Currently trading at 109.51, the instrument has violated its 10-day SMA (111.31) and is approaching a test of the 20-day SMA (114.23), which represents a crucial inflection point. The moving average structure has turned bearish, with the 10-day SMA now positioned below both the 20-day and 30-day SMAs (114.80), indicating a shift in intermediate-term momentum.
[2] Momentum indicators paint a cautionary picture for near-term price action. The RSI at 43.27 has crossed below the neutral 50 level and is trending toward oversold territory, though it hasn't yet reached levels that typically coincide with significant bounces.
[3] The MACD histogram at -1.31 reflects accelerating bearish momentum, with the signal lines in negative divergence and showing no signs of stabilization. Volume analysis reveals selling pressure has intensified during the recent decline, suggesting the breakdown is supported by genuine distribution rather than technical noise.
Key support levels are now established at the 30-day SMA around 114.80 and the psychological 110 level, while resistance has formed at the broken 10-day SMA near 111.31 and the more significant 115-116 zone. A failure to hold above 110 could accelerate the decline toward the 105-107 support cluster, while any recovery attempt would need to reclaim 115 to negate the current bearish bias and restore the uptrend structure.
Disclaimer:
Sahm is subject to the supervision and control of the CMA, pursuant to its license no. 22251-25 issued by CMA.
The Information presented above is for information purposes only, which shall not be intended as and does not constitute an offer to sell or solicitation for an offer to buy any securities or financial instrument or any advice or recommendation with respect to such securities or other financial instruments or investments. When making a decision about your investments, you should seek the advice of a professional financial adviser and carefully consider whether such investments are suitable for you in light of your own experience, financial position and investment objectives. The firm and its analysts do not have any material interests or conflicts of interest in any companies mentioned in this report.
Performance data provided is accurate and sourced from reliable platforms, including Argaam, TradingView, MarketWatch.
IN NO EVENT SHALL SAHM CAPITAL FINANCIAL COMPANY BE LIABLE FOR ANY DAMAGES, LOSSES OR LIABILITIES INCLUDING WITHOUT LIMITATION, DIRECT OR INDIRECT, SPECIAL, INCIDENTAL, CONSEQUENTIAL DAMAGES, LOSSES OR LIABILITIES, IN CONNECTION WITH YOUR RELIANCE ON OR USE OR INABILITY TO USE THE INFORMATION PRESENTED ABOVE, EVEN IF YOU ADVISE US OF THE POSSIBILITY OF SUCH DAMAGES, LOSSES OR EXPENSES.