We Value Your Feedback! Help us shape better content and experiences by participating in our survey. Join the Survey Now!
Saudi Market
TASI Technical Analysis:
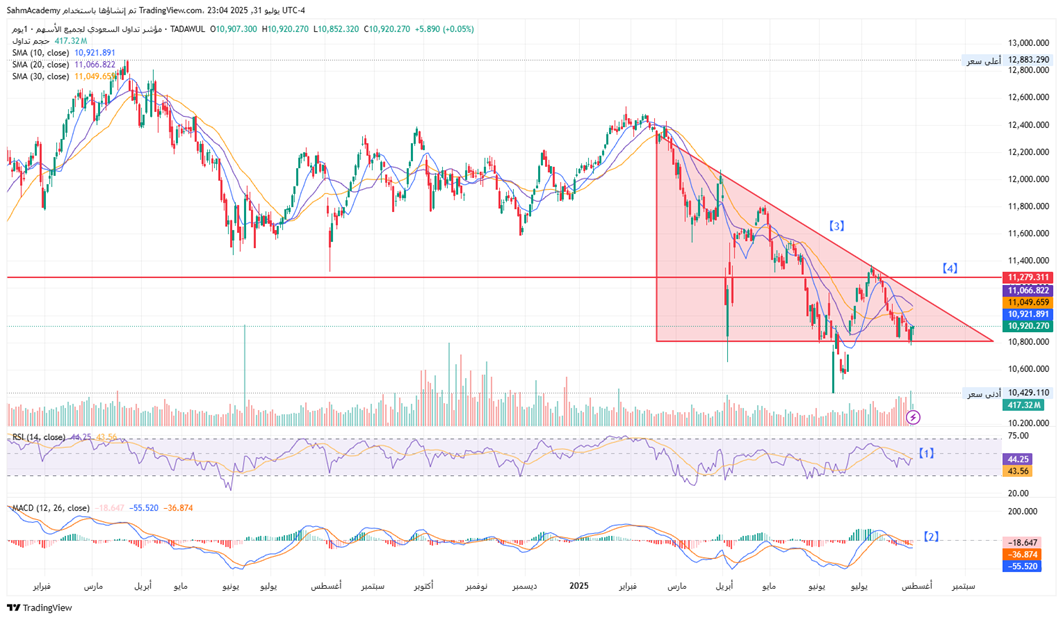
TASI is currently below all major moving averages, confirming the bearish trend, but has found significant support around 10,800.
[1] The RSI reading of 44.25 is approaching oversold territory
[2] While the MACD, though negative, shows signs of convergence, suggesting that downward momentum may be waning.
[3] The current technical pattern resembles a descending triangle formation, and investors should closely monitor the integrity of the 10,800support level.
The index faces a crucial test of the 10,800 support level in the near term - a break below could trigger accelerated selling toward the 10,400 region, while a sustained move above 11,100 with volume confirmation could target the [4] 11,800-12,000 resistance zone.
TASI Index Weekly Market Summary (July 27 to July 31)
The TASI index decreased by 0.33%. With a trading week of 5 days, the total trading volume reached 21 billion Saudi Riyals, averaging 4.2 billion per day.
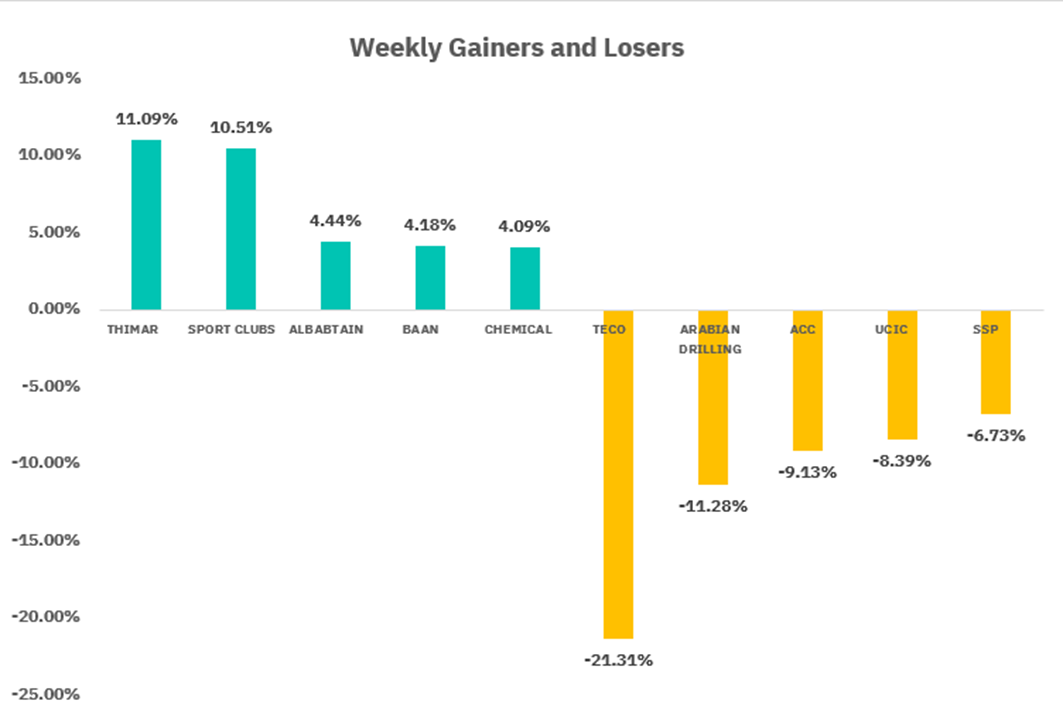
From the perspective of individual stock performance, 63 companies saw their stock prices rise this week, while 209 companies saw their stock prices fall. The companies with the highest increase included THIMAR, SPORT CLUBS, ALBABTAIN, with increases of 11.09%, 10.05%, and 4.44% respectively. The companies with the highest decline included TECO, ARABIAN DRILLING, ACC with declines of 10.27%, 8.94%, and 8.13% respectively.
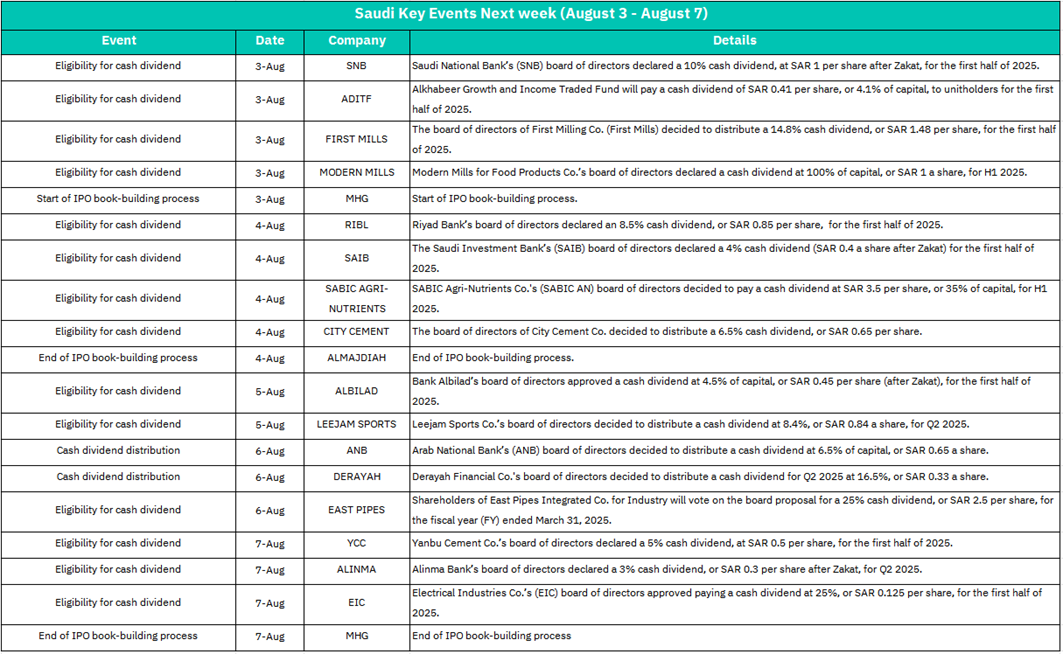
August 3 :
Eligibility for cash dividend
SNB (10% div., SAR 1/share)
ADTIF (4.1% div., SAR 0.41/unit)
FIRST MILLS (14.8% div., SAR 1.48/share)
MODERN MILLS (100% div., SAR 1/share)
Short-term buying pressure in SNB (banking leader), First Mills (consumer staples), and Modern Mills (extraordinary 100% payout). Banks (SNB) and food producers (Modern Mills, First Mills) likely outperform; ETF (ADTIF) may see retail inflows.
MHG IPO book-building starts
Capital rotation from dividend stocks to IPO subscriptions; liquidity pressure on small-caps.
August 4:
Eligibility for cash dividend
RIBL (8.5% div., SAR 0.85/share)
SAIB (4% div., SAR 0.4/share)
SABIC AGRI-NUTRIENTS (35% div., SAR 3.5/share)
CITY CEMENT (6.5% div., SAR 0.65/share)
RIBL and SAIB dividends reinforce banking stability; SNB’s lead may lift peers. SABIC Agri-Nutrients’ massive 35% payout could trigger sector re-rating (fertilizers/chem)..
August 5:
Eligibility for cash dividend
ALBILAD (4.5% div., SAR 0.45/share)
LEEJAM SPORTS (8.4% div., SAR 0.84/share)
Albilad’s payout maintains banking sector dividend momentum. Leejam Sports (fitness) dividend may attract yield seekers to retail/leisure stocks.
August 6:
Cash dividend distribution
ANB (6.5% div., SAR 0.65/share)
DERAYAH (16.5% div., SAR 0.33/share)
EAST PIPES (25% div. vote, SAR 2.5/share)
ANB (bank) and Derayah (finance) shares dip technically post-payout.
East Pipes’ proposed 25% dividend could boost industrial pipes/manufacturing stocks if approved.
August 7
Eligibility for cash dividend
YCC (5% div., SAR 0.5/share)
ALINMA (3% div., SAR 0.3/share)
ETC (25% div., SAR 0.125/share)
YCC’s payout may lift construction materials (e.g., QACCO, SPCC).ETC’s 25% yield could spark interest in electrical equipment stocks.
MHG IPO book-building ends
Oversubscription likely → bullish for healthcare sector (if MHG is medical-related).
U.S. Market
S&P500 Technical Analysis:
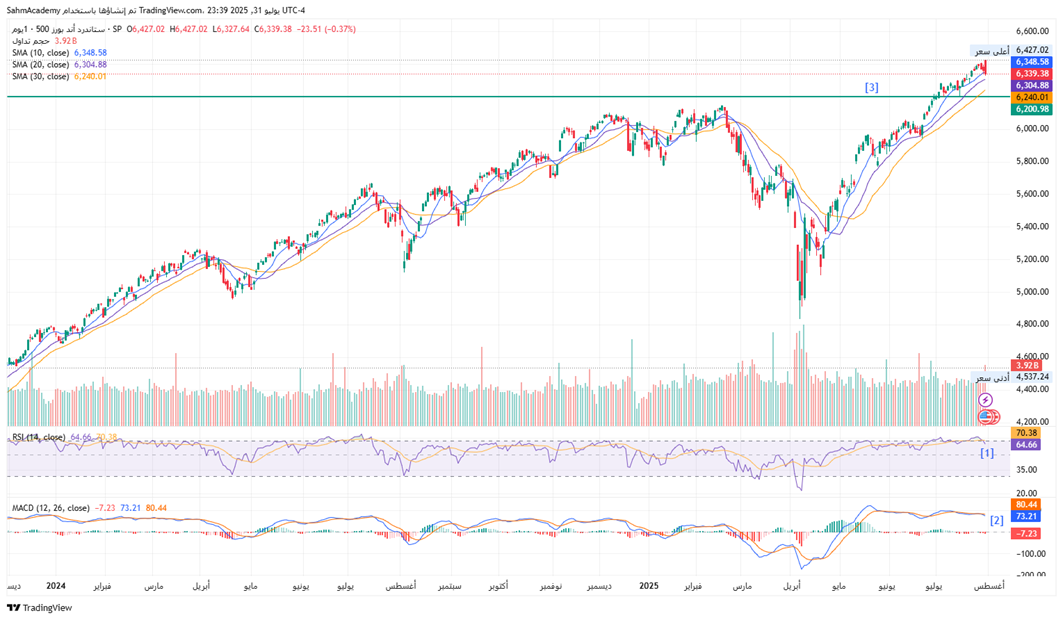
The S&P 500 maintains a strong uptrend with price action consistently above all major moving averages (SMA 10: 6,348.58, SMA 20: 6,304.88, SMA 30: 6,240.01), indicating robust institutional support.
[1] The RSI at 64.66 suggests healthy momentum without reaching overbought extremes.
[2] While the MACD shows strong positive divergence with the histogram at 80.44, confirming sustained bullish momentum.
[3] While any meaningful correction would find buyers near the 6,200 support zone.
The technical structure remains overwhelmingly bullish with immediate support at 6,300 (SMA 20 confluence) and stronger support at 6,200-6,240 (SMA 30 region).
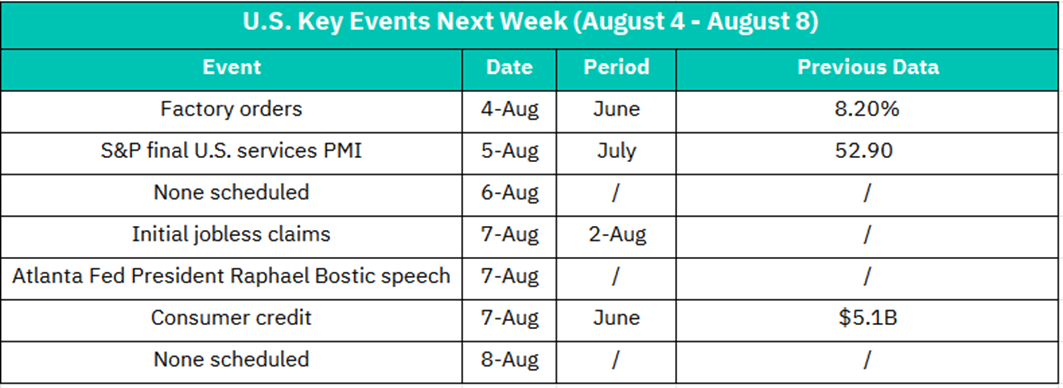
August 4:
Factory Orders (June)
Previous: +8.2% MoM
>8.2%: Boost for industrial stocks (CAT, DE), materials (XLB), and transportation (IYT).
<5.0%: Signal of manufacturing slowdown → Pressure on cyclicals; defensives (utilities, healthcare) may rally.
August 5:
S&P Final U.S. Services PMI (July)
Previous: 52.9
>53.0: Confirms economic resilience → Bullish for consumer discretionary (XLY) and financials (XLF).
<52.0 (Especially <50): Services contraction risk → Sell-off in travel/leisure (BKNG, MAR) and regional banks (KRE).
August 6: No Scheduled Events
August 7:
Initial Jobless Claims
>250K: Labor weakness → Bond rally (TLT), tech (XLK) outperforms on rate-cut hopes.
<220K: Labor strength → USD gains, banks (JPM) rise on "higher-for-longer" yields.
Initial Jobless Claims (July 26)
Claims >250k would spark labor market worries, dragging consumer stocks (Nike, Home Depot). Sub-220k may delay rate-cut bets, pressuring bonds.
August 8: No Scheduled Events
Crypto ETF Technical Analysis:
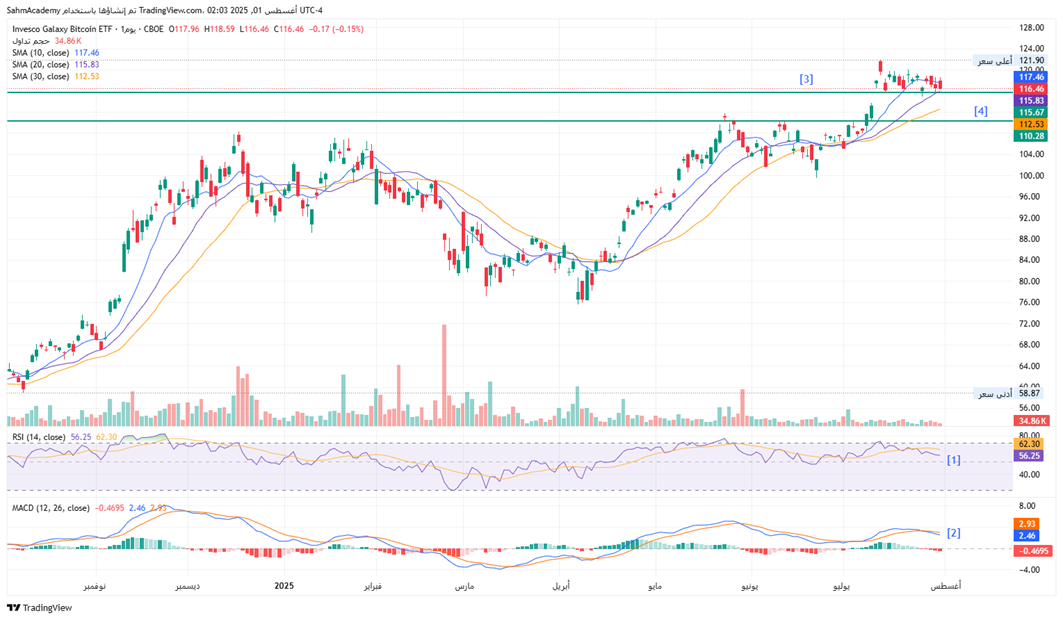
The Invesco Galaxy Bitcoin ETF (BTCO) is trading at $116.46, just below its recent all-time high of $121.90, demonstrating exceptional bullish momentum in the cryptocurrency ETF space. The price structure shows a strong uptrend with all major moving averages in bullish alignment (SMA 10: $117.46, SMA 20: $115.83, SMA 30: $112.53).
[1] The RSI at 56.25 remains in healthy territory without overbought conditions.
[2] While the MACD shows positive momentum at 2.93, though the histogram at -0.4695 suggests minor near-term consolidation.
[3] The technical setup remains overwhelmingly bullish with immediate support at $115.67 and stronger support at $110-112 (SMA 30 region).
[4] A breakout above the $122 resistance level would likely target the $130-135 zone, while any meaningful pullback should find buyers near the $110 support area.
The volume profile during the recent rally shows significant institutional accumulation, with the 25.5K volume reading indicating strong conviction behind the breakout move.
Disclaimer:
Sahm is subject to the supervision and control of the CMA, pursuant to its license no. 22251-25 issued by CMA.
The Information presented above is for information purposes only, which shall not be intended as and does not constitute an offer to sell or solicitation for an offer to buy any securities or financial instrument or any advice or recommendation with respect to such securities or other financial instruments or investments. When making a decision about your investments, you should seek the advice of a professional financial adviser and carefully consider whether such investments are suitable for you in light of your own experience, financial position and investment objectives. The firm and its analysts do not have any material interests or conflicts of interest in any companies mentioned in this report.
Performance data provided is accurate and sourced from reliable platforms, including Argaam, TradingView, MarketWatch.
IN NO EVENT SHALL SAHM CAPITAL FINANCIAL COMPANY BE LIABLE FOR ANY DAMAGES, LOSSES OR LIABILITIES INCLUDING WITHOUT LIMITATION, DIRECT OR INDIRECT, SPECIAL, INCIDENTAL, CONSEQUENTIAL DAMAGES, LOSSES OR LIABILITIES, IN CONNECTION WITH YOUR RELIANCE ON OR USE OR INABILITY TO USE THE INFORMATION PRESENTED ABOVE, EVEN IF YOU ADVISE US OF THE POSSIBILITY OF SUCH DAMAGES, LOSSES OR EXPENSES.