
We Value Your Feedback! Help us shape better content and experiences by participating in our survey. Join the Survey Now!
Saudi Market
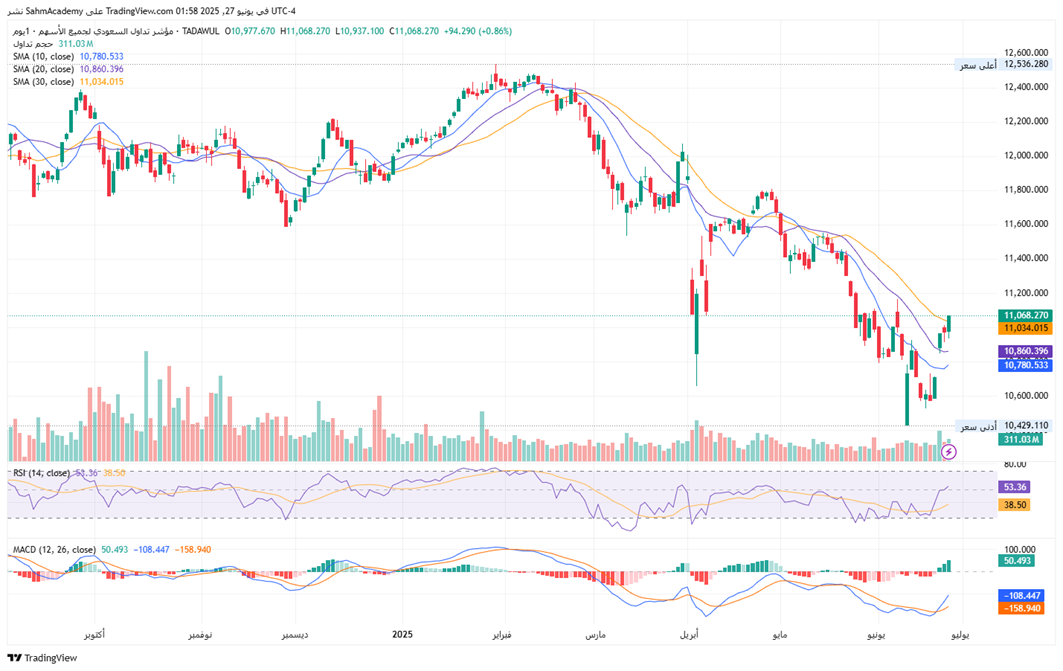
TASI Technical Analysis:
The Saudi market is currently exhibiting a technical rebound within a broader intermediate-term downtrend. The index is now testing critical resistance at the 11,100-11,200 level after bouncing from potential double-bottom support near 10,429-10,600, representing a significant 16.5% correction from peak to trough. While short-term technical indicators show improvement with RSI at 53.36 (neutral zone) and MACD displaying a bullish crossover signal, the index remains below key moving averages and faces substantial resistance layers up to 12,000. The critical determinant being whether the index can decisively break above 11,200 with volume confirmation or alternatively break below 10,600 support. Trading strategy should focus on the 10,600-11,200 range with tight risk management, while monitoring oil prices and regional geopolitical factors that typically influence Saudi market sentiment. The next 2-6 weeks will likely resolve this technical consolidation pattern and determine the market's intermediate-term direction.
TASI Index Weekly Market Summary (June 22 to June 26)
The TASI index increased by 4.67%. With a trading week of 5 days, the total trading volume reached 28 billion Saudi Riyals, averaging 5.6 billion per day.
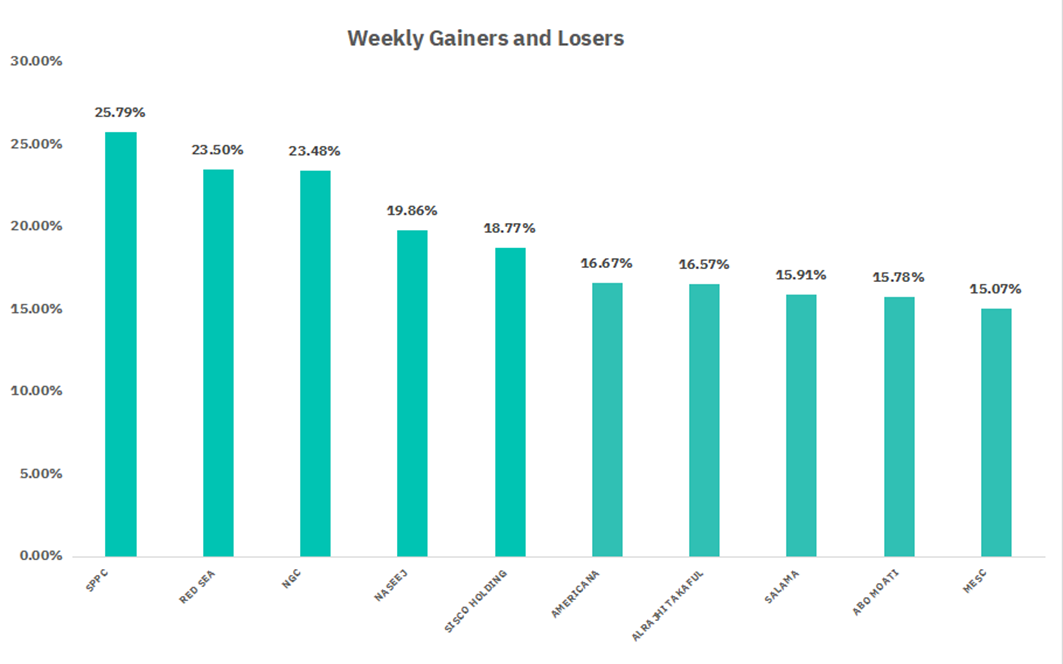
Share prices advanced for 265 companies this week, with 10 firms posting increases exceeding 15%. Declines were limited to only six companies. Leading the advancers were SPPC, RED SEA, and NGC, posting gains of 25.79%, 23.50%, and 23.48% respectively.
Saudi stocks rose this week, helped by easing geopolitical tensions, while the Saudi Central Bank's (SAMA) decision to maintain interest rates in line with other regional banks also provided stability.
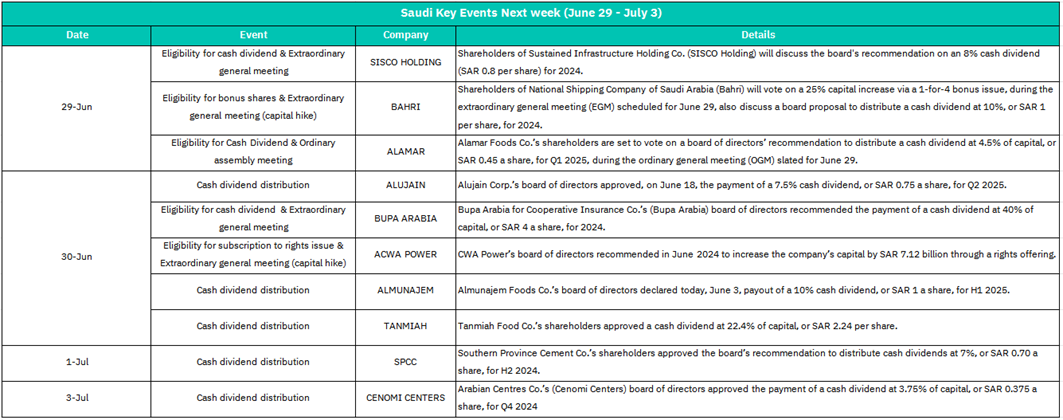
June 29:
SISCO HOLDING
EGM to approve 9% cash dividend (SAR 0.8/share) for 2024.
Likely positive short-term sentiment due to shareholder returns. Stock may see pre-dividend demand.
BAHRI
EGM for 25% bonus issue (1-for-4) and 10% cash dividend (SAR 1/share) for 2024.
Bonus issue could dilute EPS short-term but signals growth confidence. High dividend may attract income investors. Stock volatility expected around EGM.
ALAMAR
OGM to vote on 4.5% cash dividend (SAR 0.48/share) for Q1 2025.
Modest dividend may support stock stability; approval reinforces shareholder trust.
June 30:
ALUJAIN
7.5% cash dividend (SAR 0.75/share) distribution for Q2 2025.
Ex-dividend price adjustment likely; long-term appeal for dividend-focused investors.
BUPA ARABIA
EGM to discuss 40% cash dividend (SAR 4/share) for 2024.
High yield (40%) could trigger significant pre-meeting buying pressure. Positive if approved.
ACWA POWER
EGM for SAR 7.12bn rights issue (capital hike).
Potential dilution and short-term sell-off. Sentiment hinges on growth use of funds (e.g., renewables expansion).
ALMUNAJEM & TANMIAH
Dividend distributions (10% and 22.4% respectively).
Immediate ex-dividend adjustments. TAMHIAN’s high payout may boost retail interest.
July 1:
SPCC
7% cash dividend (SAR 0.70/share) distribution for H2 2024.
Routine adjustment; signals sector stability. Limited volatility.
July 3:
CENOMI CENTERS
3.75% cash dividend (SAR 0.375/share) distribution for Q4 2024.
Minor price adjustment; reflects consistent shareholder returns in retail sector.
U.S. Market
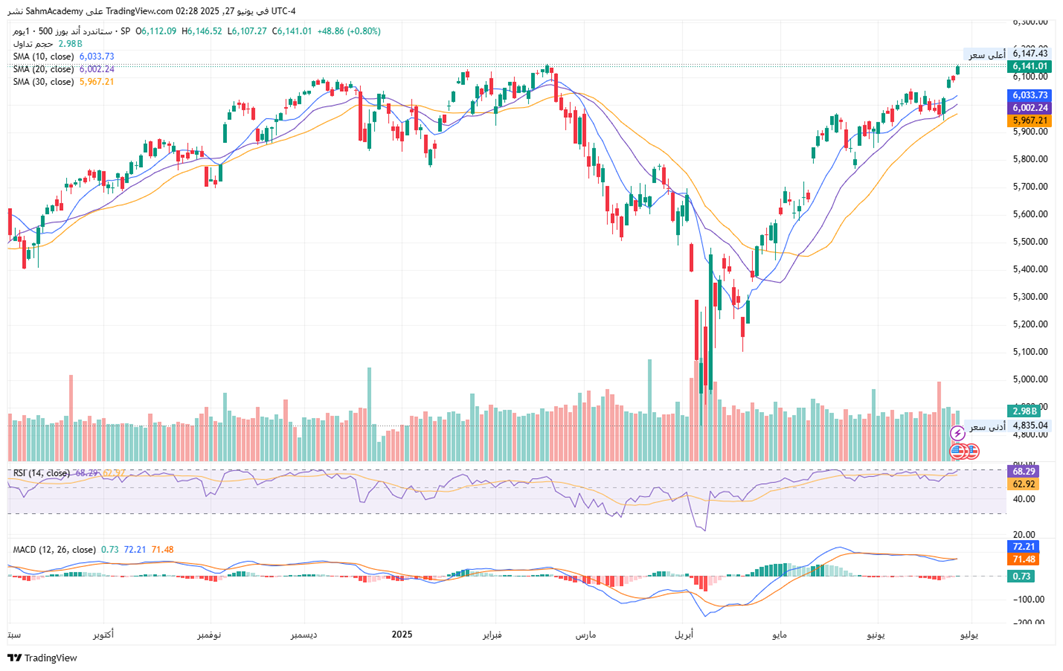
S&P500 Technical Analysis:
The S&P 500 is displaying exceptional bullish momentum with a textbook V-shaped recovery from March 2025 lows around 4,835 to new all-time highs at 6,147.43, representing a remarkable 27.1% rally over 3-4 months. The current technical setup shows all moving averages in perfect bullish alignment (10-day at 6,033, 20-day at 6,002, 30-day at 5,967), with the index consolidating in a healthy bull flag pattern near record highs. Key technical indicators strongly support continued upside momentum: RSI at 62.92 remains in bullish territory with room for further gains, MACD shows sustained strength above zero with an expanding histogram at 0.73, and volume analysis confirms institutional accumulation on any dips. The critical resistance level sits at 6,160 (all-time high), while major support is established at 6,000-6,030, with extended upside targets pointing toward 6,200-6,300 based on measured move projections from the current bull flag formation. Minimal downside risk given the robust support structure, this represents one of the strongest technical configurations for sustained upward momentum, though standard risk management remains prudent given the all-time high territory and potential for normal consolidation phases.

June 30
Chicago PMI (June)
Previous: 40.50
Weakness may heighten recession fears, pressuring cyclical stocks. Surprise rebound could lift sentiment.
July 1
S&P Manufacturing PMI (June Final)
Previous: 52.00 (expansion)
Confirmation of expansion supports industrials; decline may trigger growth concerns.
Construction Spending (May)
Previous: -0.40%
Further decline could hurt homebuilders (e.g., DHI, LEN) and materials stocks.
JOLTS Job Openings (May)
Previous: 7.4 million
Numbers >7.5M may signal labor resilience, lifting USD; <7.0M could fuel rate-cut bets.
July 2
ADP Employment (June)
Previous: 37,000
Weak data (<50K) = stocks rally (rate-cut hopes); strong print (>100K) = bond yields rise, tech stocks pressured.
July 3
Initial Jobless Claims (Week of June 28)
Rising claims (>230K) = risk-asset positive; low claims = Fed hawkishness fears.
Unemployment Rate (June)
Previous: 4.20%
Increase to >4.3% = market rally; drop to <4.1% = equities sell-off.
S&P Services PMI (June Final)
Previous: 53.70
Services drive 70% of GDP; readings <53.0 may spark growth worries.
July 4:
Independence Day Holiday: Markets closed
Crypto ETF Technical Analysis:
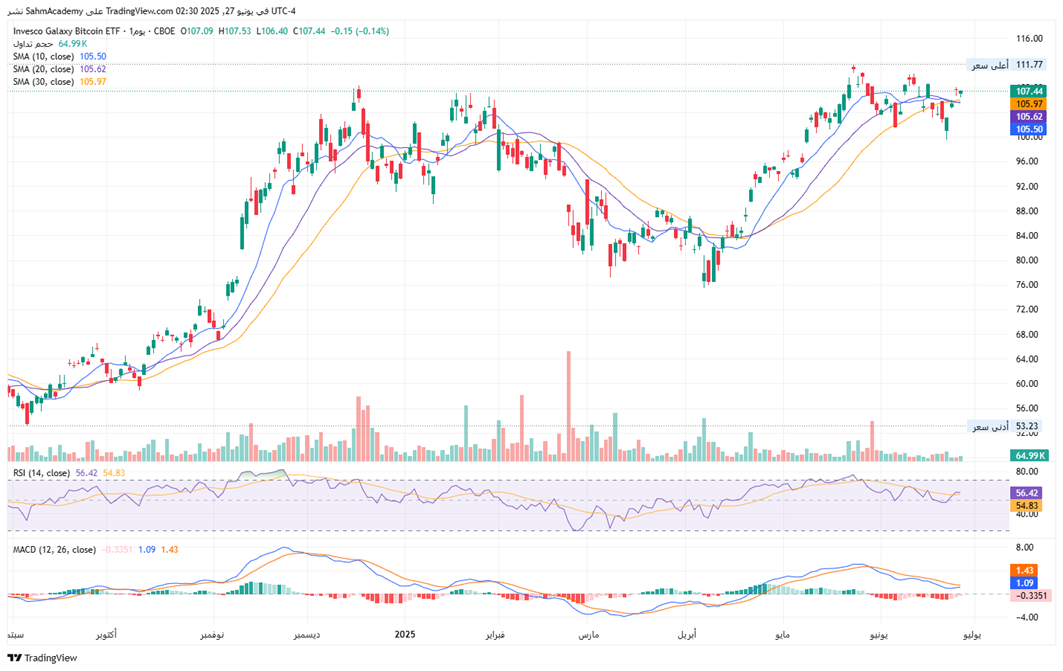
The Invesco Galaxy Bitcoin ETF (BTCO) is displaying a classic consolidation pattern after completing a significant recovery from March 2025 lows around 76-78 to recent highs near 111.77, representing a robust 43% rally over the past 3-4 months. The current price of $107.44 is consolidating in a tight sideways range between $105-$112, with all major moving averages (10-day at 105.50, 20-day at 105.62, 30-day at 105.97) clustered together in a neutral configuration, indicating equilibrium between buyers and sellers. Technical indicators present a mixed but cautiously optimistic picture: RSI at 56.42 sits in neutral territory with slight bullish bias, while MACD shows a positive crossover at 1.09 above the signal line of 1.43, suggesting emerging bullish momentum despite still being in positive territory. The volume pattern reveals accumulation on up-days with lighter selling pressure during pullbacks, typical of institutional positioning in crypto ETFs. Key resistance lies at the recent high of $111.77, while critical support is established at $105 and stronger support at $100-$102. Given Bitcoin's inherent volatility and the ETF's recent technical strength, probability of an upside breakout toward $115-$120 contingent on broader crypto market sentiment and Bitcoin's ability to maintain its current technical structure.
Disclaimer:
Sahm is subject to the supervision and control of the CMA, pursuant to its license no. 22251-25 issued by CMA.
The Information presented above is for information purposes only, which shall not be intended as and does not constitute an offer to sell or solicitation for an offer to buy any securities or financial instrument or any advice or recommendation with respect to such securities or other financial instruments or investments. When making a decision about your investments, you should seek the advice of a professional financial adviser and carefully consider whether such investments are suitable for you in light of your own experience, financial position and investment objectives. The firm and its analysts do not have any material interests or conflicts of interest in any companies mentioned in this report.
Performance data provided is accurate and sourced from reliable platforms, including Argaam, TradingView, MarketWatch.
IN NO EVENT SHALL SAHM CAPITAL FINANCIAL COMPANY BE LIABLE FOR ANY DAMAGES, LOSSES OR LIABILITIES INCLUDING WITHOUT LIMITATION, DIRECT OR INDIRECT, SPECIAL, INCIDENTAL, CONSEQUENTIAL DAMAGES, LOSSES OR LIABILITIES, IN CONNECTION WITH YOUR RELIANCE ON OR USE OR INABILITY TO USE THE INFORMATION PRESENTED ABOVE, EVEN IF YOU ADVISE US OF THE POSSIBILITY OF SUCH DAMAGES, LOSSES OR EXPENSES.
