
We Value Your Feedback! Help us shape better content and experiences by participating in our survey. Join the Survey Now!
Saudi Market
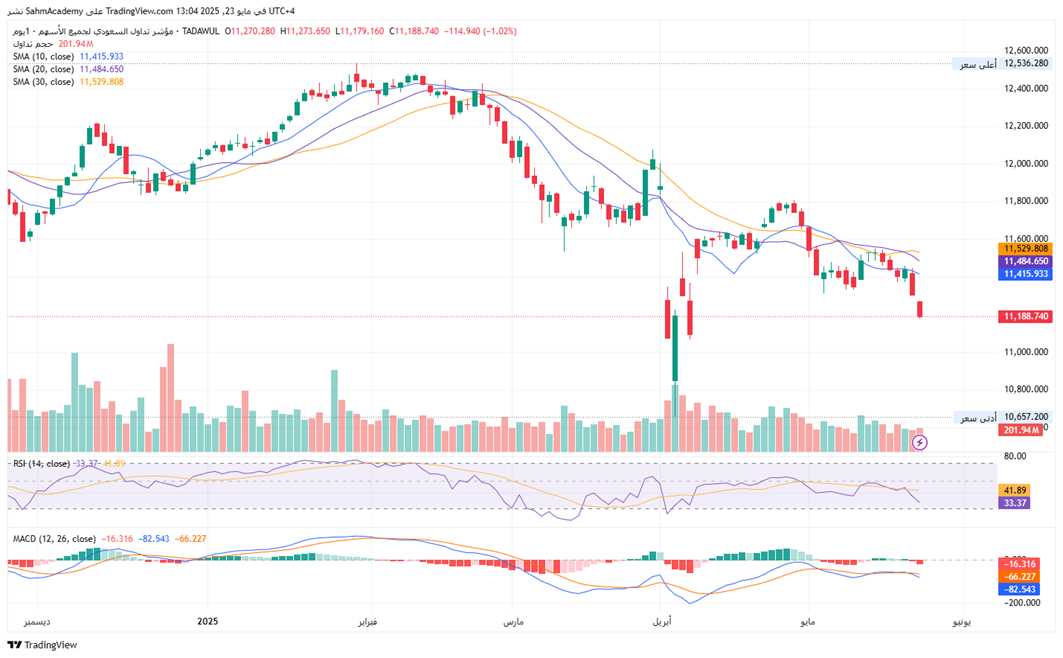
TASI Technical Analysis:
The TASI reveals a confirmed downtrend since January 2025, consolidating between 10,657.2 and 11,800.0. Key resistance levels stand at 11,800 (recent high) and 11,415 (10-day SMA). The RSI at 41.89 reach the oversold zone, hinting at potential short-term rebound, but remains below 50, confirming bearish momentum; watch for bullish divergence if prices make a new low below 10,657.200 with RSI holding above 30. The MACD line lies below the signal line with negative histograms, indicating sustained bearish pressure. Volume analysis shows recent sell-offs were validated by rising volume, while rallies saw muted participation, reflecting weak trading conviction.
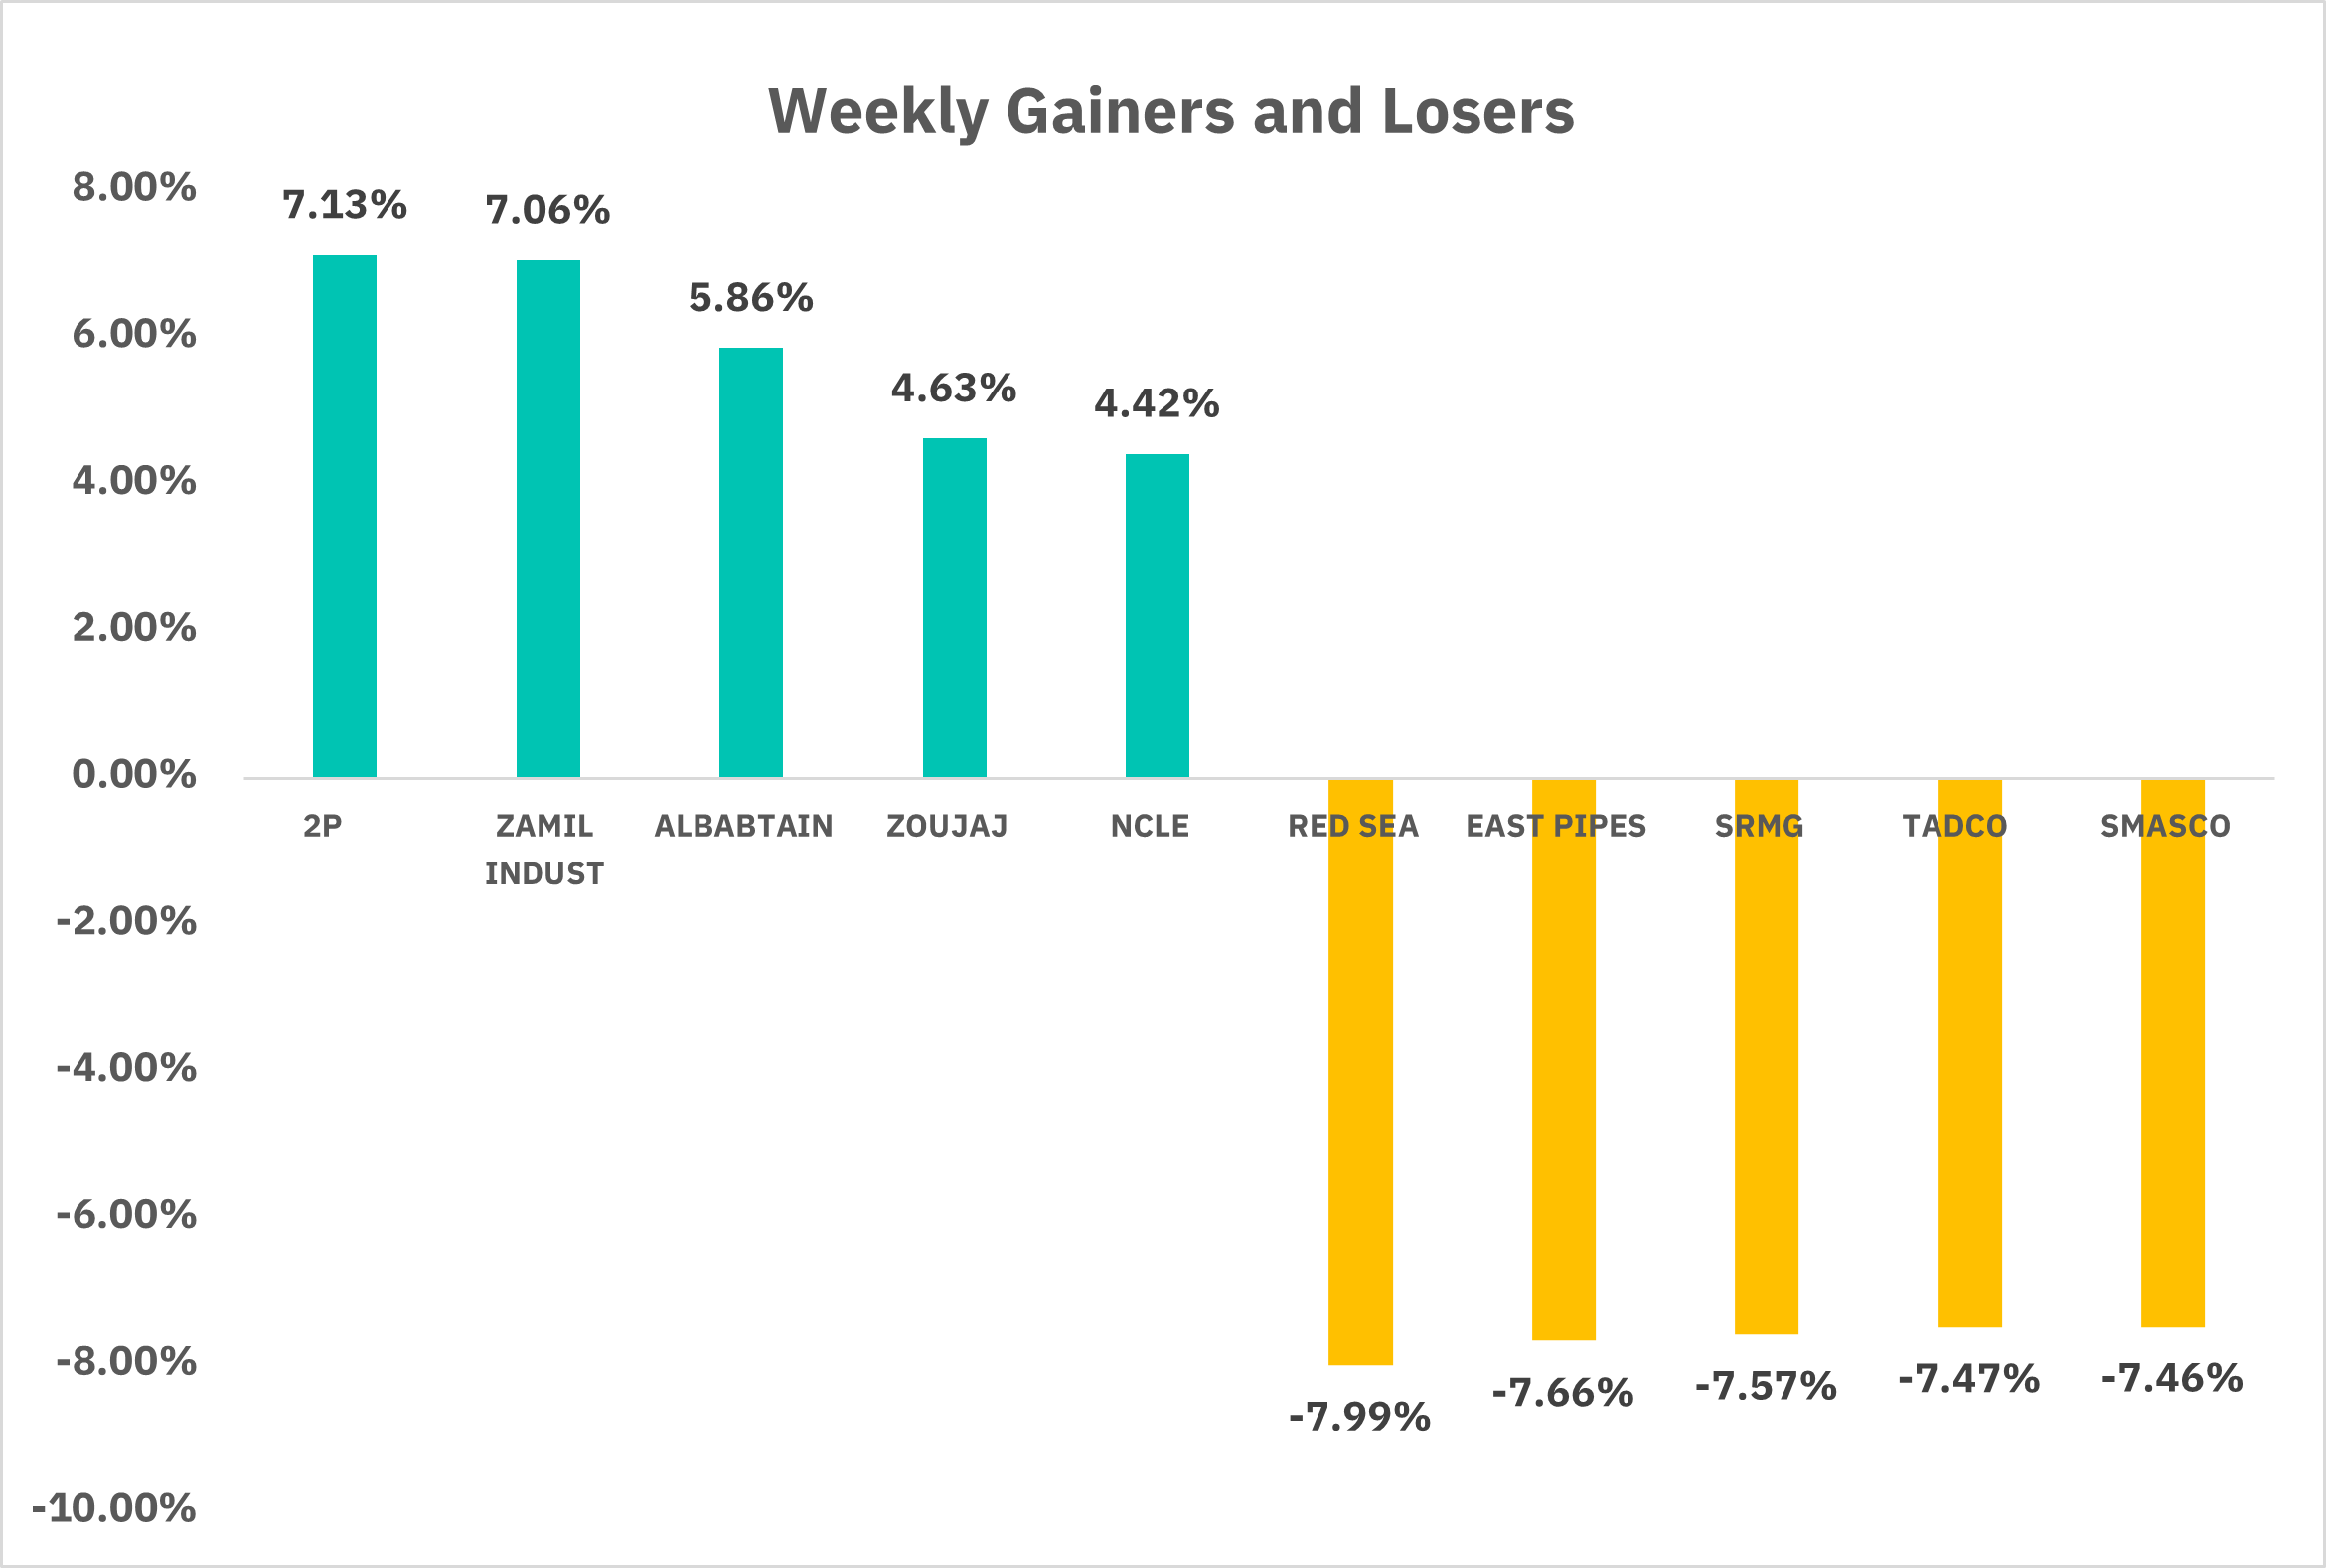
TASI Index Weekly Market Summary (May 18 to May 22)
The TASI index decreased by 2.19%. With a trading week of 5 days, the total trading volume reached 22 billion Saudi Riyals, averaging 4.4 billion per day.
From the perspective of individual stock performance, 39 companies saw their stock prices rise this week, while 222 companies saw their stock prices fall. The companies with the highest increase included 2P, ZAMIL INDUST, ALBABTAIN, with increases of 7.13%, 7.06% , and 5.86% respectively. The companies with the highest decline included RED SEA, EAST PIPES, SRMG, with declines of 7.99%, 7.66%, and 7.57% respectively.
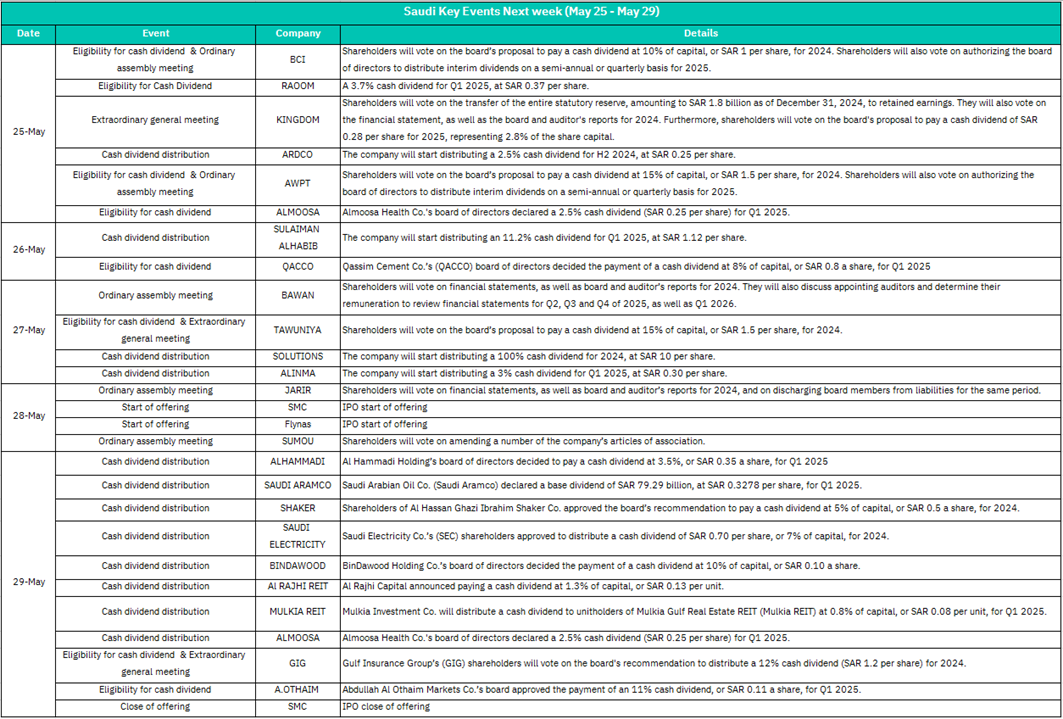
1.May 25
BCI: Shareholders vote on a 1.0% cash dividend (SAR 1/share) for 2024 and interim dividend authorization for 2025.
Likely positive sentiment due to shareholder-friendly dividend policy, though small yield may limit enthusiasm.
RAOOM: 3.7% Q1 2025 dividend (SAR 0.37/share) eligibility.
Attractive yield could boost short-term demand for RAOOM shares.
KINGDOM: Vote on transferring SAR 1.8B statutory reserve to retained earnings and a 2.8% dividend (SAR 0.28/share) for 2025.
Reserve transfer signals strong retained earnings, supporting long-term growth. Dividend approval may stabilize investor confidence.
ARDCO: Starts distributing 2.5% Q1 2024 dividend (SAR 0.25/share).
Routine payout; minimal market reaction unless liquidity constraints arise.
AWPT: Vote on 15% dividend (SAR 1.5/share) for 2024 and interim dividends for 2025.
High dividend yield (15%) could trigger significant buying interest if approved.
ALMOOSA: Declares 2.5% Q1 2025 dividend (SAR 0.25/share).
Neutral to mildly positive, aligning with sector standards.
2. May 26
SULAIMAN ALHABIB: Distributes 11.2% Q1 2024 dividend (SAR 1.12/share).
High payout ratio may attract income-focused investors, but post-dividend price adjustment likely.
QACCO: Approves 8% dividend (SAR 0.8/share) for Q1 2025.
Cement sector stability; dividend aligns with industry norms, supporting steady investor interest.
3. May 27
BAWAN: To discuss financials, auditor appointments, and future reporting.
Transparency improvements could boost trust, but lack of dividends may temper enthusiasm.
SOLUTIONS: Distributes 100% dividend (SAR 1.0/share) for Q1 2024.
Extraordinary payout signals strong liquidity, but sustainability concerns may arise.
ALINMA: Distributes 3% Q1 2025 dividend (SAR 0.30/share).
Modest yield; unlikely to drive significant trading volume.
4. May 28
Flynas/SWC: Flynas and SWC IPO launch.
Flynas and SWC IPO could divert liquidity temporarily; successful launch may uplift market sentiment.
SUMOU: Votes on amendments to articles of association.
Governance changes could enhance operational flexibility, but market reaction depends on specifics.
5. May 29
ALHAMMADI: 3.5% dividend (SAR 0.35/share) for Q1 2025.
Healthcare sector stability; neutral impact.
SAUDI ARAMCO: Declares SAR 79.29B base dividend (SAR 0.3278/share).
Massive payout reinforces Aramco’s role as a market anchor, stabilizing the Tadawul index.
Dividends of 40% (SAR 4/share), 10% (SAR 1/share), and 5% (SAR 0.05/share) proposed.
SHAKER/SAUDI ELECTRICITY/BINDAWOOD: Multiple dividend approvals (5%–7%).
Sector-wide dividend consistency supports overall market stability.
REITs (Al RAJHI, MULKIA): Distributions at 0.8%–1.3%.
Low yields for REITs may disappoint income investors, potentially pressuring prices.
GIG: Vote on 12% dividend (SAR 1.2/share) for 2024.
High yield could drive short-term rally in GIG shares if approved.
A.OTHAIM: 11% dividend (SAR 0.11/share) for Q1 2025.
Retail sector resilience; payout aligns with expectations.
U.S. Market
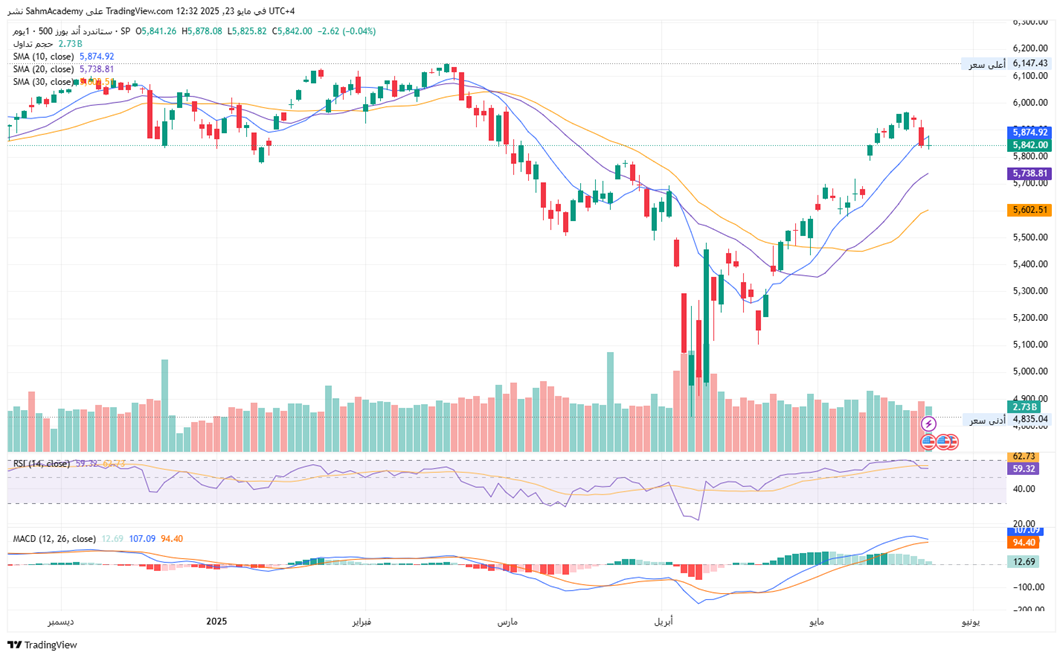
S&P500 Technical Analysis:
S&P 500 Index reveals a short-term downtrend over the past three months, the index currently testing support at 5,602.51 (30-day SMA). A bearish flag pattern formed between April and May 2025. Key resistance levels sit at 5,874.92 (10-day SMA), while a breakdown below 5,602.51 could target 5,500.00. The moving averages show a bearish alignment (10-day SMA < 20-day SMA < 30-day SMA), with prices consistently below all key SMAs, reinforcing selling pressure. The RSI at 62.73 is neutral but declining while a potential bullish divergence may emerge if prices below 5,602.51 with RSI holding above 50. Volume analysis shows recent sell-offs were validated by rising volume, while rallies saw muted participation, indicating weak bullish conviction. While the index shows tentative consolidation near support, the broader trend remains bearish, with traders advised to wait for volume-confirmed breakouts or RSI divergence before committing, prioritizing risk control near multi-month lows.
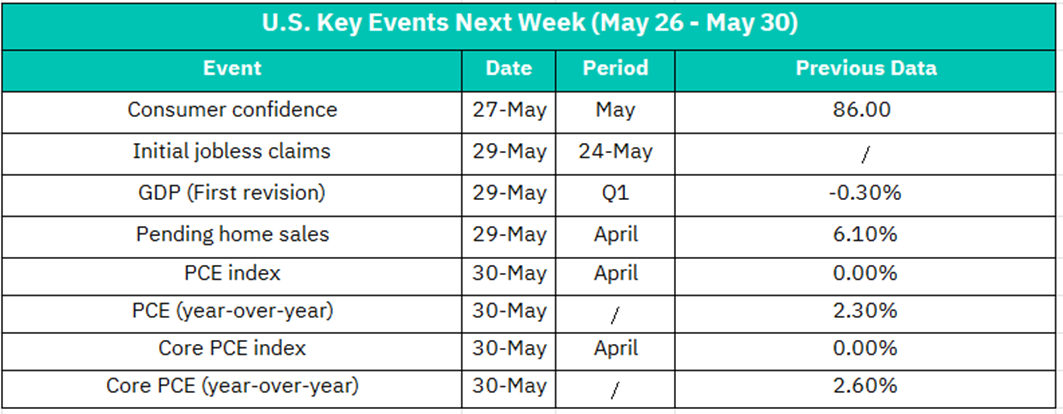
May 27 –Consumer Confidence (May)
Previous: 86.00
A higher-than-expected reading could signal stronger consumer spending, boosting retail and cyclical stocks. Conversely, a decline might raise concerns about economic momentum, pressuring equities.
May 29 –Initial Jobless Claims (Week of May 24)
A drop in claims would reinforce labor market resilience, supporting risk assets. A rise could trigger fears of slowing growth, weighing on equities, especially cyclical sectors.
–GDP Revision (Q1)
Previous: -0.30%
An upward revision (e.g., to positive territory) would alleviate recession worries and lift market sentiment. A downward revision could amplify concerns about economic contraction, dragging indices lower.
– Pending Home Sales (April)
Previous: +6.10%
Strong sales growth may boost housing-related stocks (e.g., homebuilders, construction materials). A miss could indicate cooling demand, impacting the sector negatively.
May 30 –PCE Index (April)
Previous: 0.00% MoM / 2.30% YoY
Hotter-than-expected inflation could revive Fed rate hike fears, pressuring tech and growth stocks. A softer print would ease tightening concerns, supporting equities.
– Core PCE Index (April)
Previous: 0.00% MoM / 2.60% YoY
As the Fed’s preferred inflation gauge, a surprise increase above 2.6% YoY could trigger bond yield spikes and equity volatility. Stability or a decline would be viewed favorably.
Crypto ETF Technical Analysis:
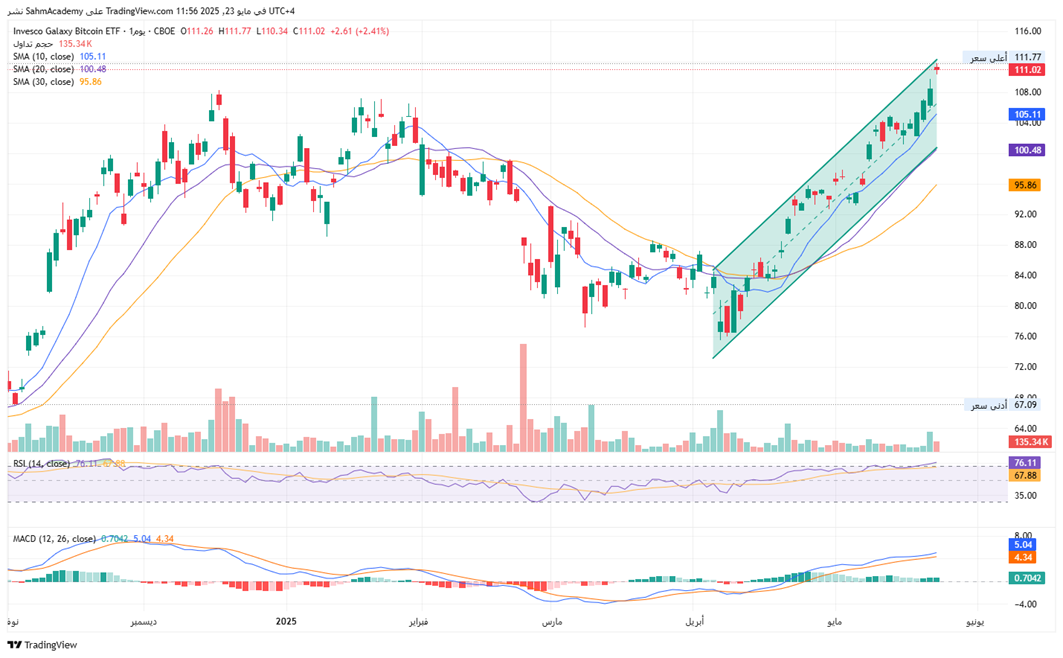
BTCO is forming an ascending channel, a bullish pattern, with prices consolidating between $100.48 (SMA 30 support) and a descending resistance line. A breakout above $111.77 (April high) would confirm bullish momentum, while a close below $100.48 could invalidate the uptrend, pointing to $95.86. The 10-day ($105.11) > 20-day ($100.48) > 30-day ($95.86) SMA alignment reinforces the short-term uptrend, with a bullish crossover in May. The RSI at 76.11 signals overbought conditions, requiring vigilance for bearish divergence, while the MACD shows a bullish crossover with rising green bars. Volume has moderately confirmed upward moves, with heavy accumulation near $95.86 earlier. BTCO remains in a bullish consolidation, but overbought conditions necessitate caution; monitor RSI/MACD divergence for reversal signals.
Disclaimer:
Sahm is subject to the supervision and control of the CMA, pursuant to its license no. 22251-25 issued by CMA.
The Information presented above is for information purposes only, which shall not be intended as and does not constitute an offer to sell or solicitation for an offer to buy any securities or financial instrument or any advice or recommendation with respect to such securities or other financial instruments or investments. When making a decision about your investments, you should seek the advice of a professional financial adviser and carefully consider whether such investments are suitable for you in light of your own experience, financial position and investment objectives. The firm and its analysts do not have any material interests or conflicts of interest in any companies mentioned in this report.
Performance data provided is accurate and sourced from reliable platforms, including Argaam, TradingView, MarketWatch.
IN NO EVENT SHALL SAHM CAPITAL FINANCIAL COMPANY BE LIABLE FOR ANY DAMAGES, LOSSES OR LIABILITIES INCLUDING WITHOUT LIMITATION, DIRECT OR INDIRECT, SPECIAL, INCIDENTAL, CONSEQUENTIAL DAMAGES, LOSSES OR LIABILITIES, IN CONNECTION WITH YOUR RELIANCE ON OR USE OR INABILITY TO USE THE INFORMATION PRESENTED ABOVE, EVEN IF YOU ADVISE US OF THE POSSIBILITY OF SUCH DAMAGES, LOSSES OR EXPENSES.
