
We Value Your Feedback! Help us shape better content and experiences by participating in our survey. Join the Survey Now!
Saudi Market
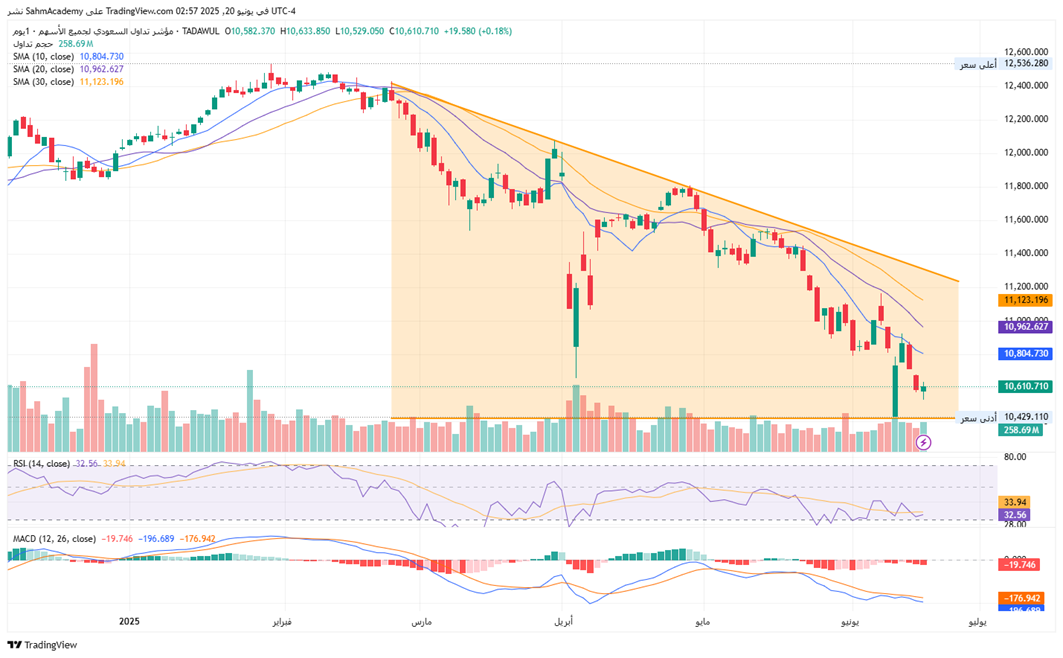
TASI Technical Analysis:
The TASI index (10,610.71) remains entrenched in a structural bear trend with price trading below all declining moving averages (SMA 10/20/30 at 10,804.73/10,962.63/11,123.20), exhibiting accelerating bearish momentum evidenced by the deeply negative MACD histogram (-176.942) and distribution-volume patterns with oversold RSI (32.56). Critical support rests at 10,429.11 – a breakdown would target the 10,000-9,800 measured move projection of the descending triangle formation, while any technical bounce faces layered resistance at 10,800 (SMA 10) and 11,000 (SMA 20 confluence), requiring a decisive close above 11,123 (SMA 30) to invalidate the dominant downtrend.

TASI Index Weekly Market Summary (June 15 to June 19)
The TASI index decreased by 1.13%. With a trading week of 5 days, the total trading volume reached 27 billion Saudi Riyals, averaging 5.5 billion per day.
From the perspective of individual stock performance, 73 companies saw their stock prices rise this week, while 189 companies saw their stock prices fall. The companies with the highest increase included MASAR, SABIC AGRI-NUTRIENTS, SRMG, with increases of 9.44%, 9.22% , and 8.61% respectively. The companies with the highest decline included FARM SUPERSTORES, MBC GROUP, GULF UNION ALAHLIA, with declines of 9.84%, 9.61%, and 8.54% respectively.

June 22:
TAWUNIYA: Cash dividend distribution (15%, SAR 1.5/share for 2024).
Short-term price drop expected (ex-dividend adjustment); positive sentiment for insurance sector.
SSP: Cash dividend distribution (10%, SAR 1/share for 2024).
Technical price decline post-distribution; signals industrial sector stability.
ALUJAIN: Eligibility for cash dividend (7.5%, SAR 0.75/share for Q2 2025).
Shares trade ex-dividend – immediate price drop ≈ SAR 0.75; may attract yield-seeking investors.
ACIG: Eligibility for rights issue & EGM (20.9M new shares at SAR 10/share).
Potential short-term dilution; long-term growth if capital deployed well. Low subscription could trigger sell-off.
June 23:
2P: Ordinary assembly meeting (vote on interim dividends for 2025).
Approval likely bullish (signals consistent shareholder returns); rejection would pressure stock.
June 24:
SAL: Eligibility for cash dividend (14.3% for Q1 2025) & OGM.
Ex-dividend date – price dip expected; high yield may support post-meeting rebound.
SAIC: Eligibility for cash dividend (10%, SAR 1/share) & OGM.
Dividend approval priced in; unexpected rejection would cause sharp decline.
June 25:
A.OTHAIM MARKET: Cash dividend distribution (13%, SAR 0.11/share for Q1 2025).
Minimal price impact (adjustment already occurred); affirms retail sector resilience.
GIG: Cash dividend distribution (12%, SAR 1.2/share for 2024).
Neutral post-distribution; reinforces insurance sector attractiveness.
TALCO: Eligibility for cash dividend (16%, SAR 1.6/share) & EGM.
Ex-dividend drop ≈ SAR 1.6; high yield could spur buying pre-meeting.
ENTAJ: Eligibility for cash dividend (5%, SAR 0.5/share) & EGM.
Low yield may disappoint investors; rejection risk could amplify selling.
TAMKEEN: Eligibility for cash dividend (20.8%, SAR 2.09/share) & EGM.
Significant ex-dividend adjustment; high yield likely to drive pre-vote demand.
FAKEEH CARE: Eligibility for cash dividend (30%, SAR 0.3/share) & EGM.
Highest yield – aggressive price volatility; approval may trigger sector-wide rally in healthcare.
June 25:
APC: Cash dividend distribution (15%, SAR 0.15/share for 2024).
Technical decline post-payout; industrial sector sentiment gauge.
MIANONA: Eligibility for cash dividend (10%, SAR 0.10/share) & OGM.
Ex-dividend pressure (≈SAR 0.10); small-cap volatility likely around vote.
U.S. Market
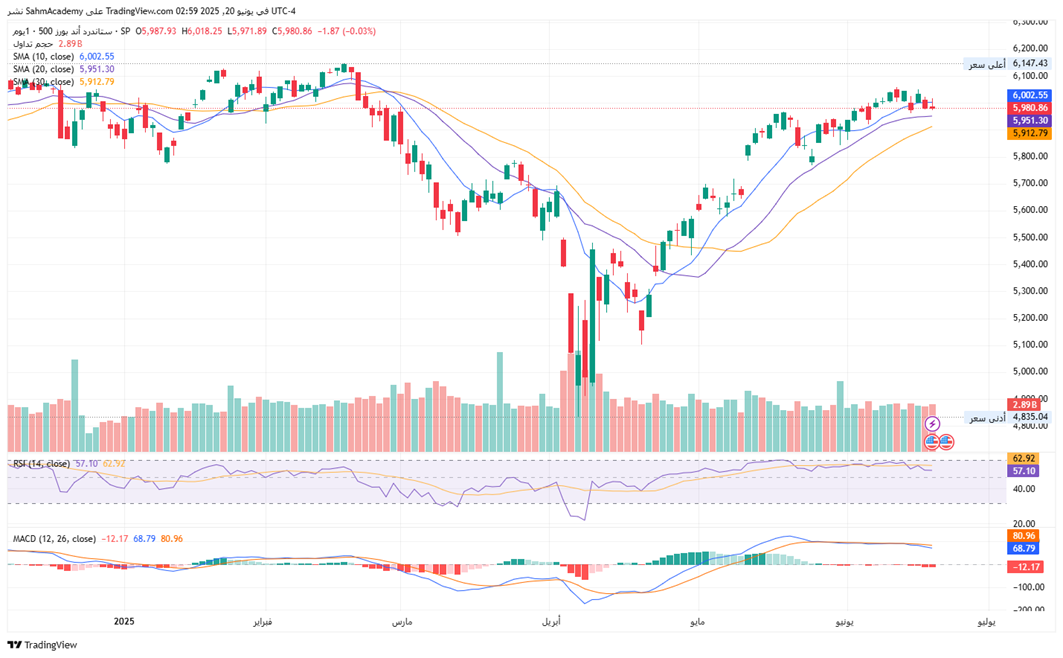
S&P500 Technical Analysis:
The S&P 500 is consolidating near the upper end of its yearly range, approximately 2.7% below all-time highs, within a structurally intact intermediate-term bullish trend characterized by ascending moving averages (price above SMA 20/30) and a developing bull flag pattern following the strong advance from March lows. Technical indicators present a neutral-to-bullish bias: RSI (57.10) suggests room for upside without overbought conditions, while MACD shows stabilizing momentum despite a recent negative crossover. Critical support resides at the SMA 30 (5,912) and the 5,950-5,951 zone (SMA 20), with resistance at 6,000-6,020 (SMA 10) and the all-time high (6,147).
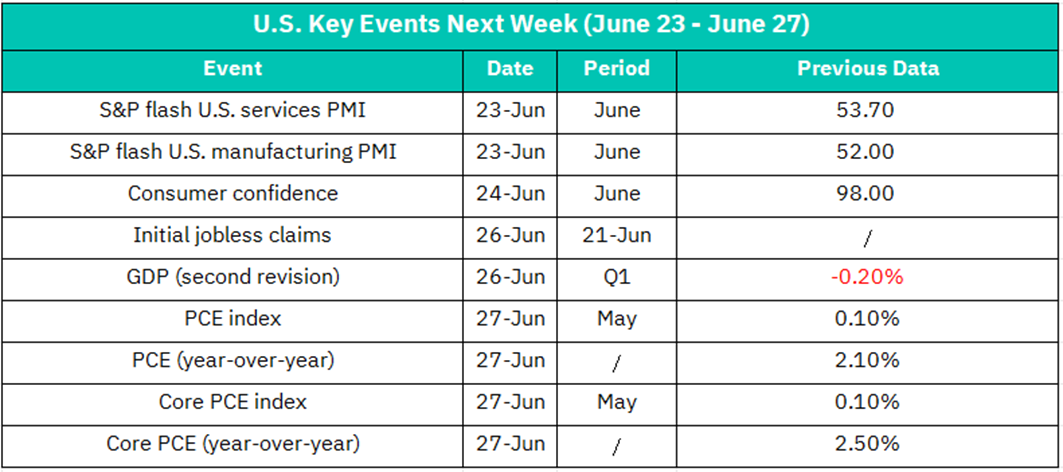
June 23
S&P Flash U.S. Services PMI (June; Prev: 53.7)
Above 53.7 = Bullish (confirms service-sector resilience, lifts cyclicals). Below 53 = Bearish (stokes growth fears; hits retail, travel stocks).
S&P Flash U.S. Manufacturing PMI (June; Prev: 52.0)
PMI>52.5 = Industrial/tech rally. <51.0 = Recession alarms; pressures industrials (CAT, BA) and semis (NVDA).
June 24
Consumer Confidence (June; Prev: 98.0)
Consumer Confidence >100 = Boosts consumer discretionary (AMZN, TSLA). <95 = Sell-off risk (weakened spending outlook hits retail, luxury stocks).
June 26
Initial Jobless Claims (Week of June 21; Prev: N/A)
Claims >240K = Bond yield drop, tech/growth stock relief (rate-cut hopes). <210K = Hawkish Fed fears; financials (JPM) rally, tech dips.
GDP Revision (Q1) (Prev: -0.2%)
Upward revision (e.g., >0%) = Short-term dollar/equity boost. Worse contraction (e.g., <-0.5%) = Defensive shift (utilities, healthcare).
June 27 (Friday)
PCE Index MoM/YoY (May; Prev: 0.1% MoM / 2.1% YoY)
YoY >2.3% = Market panic (delayed rate cuts); sinks rate-sensitive stocks (real estate, tech). <2.0% = Rally (Fed pivot bets).
Core PCE MoM/YoY (May; Prev: 0.1% MoM / 2.5% YoY)
Core YoY >2.6% = SPX sell-off (bond yields spike). Core MoM ≤0.1% = "Goldilocks" relief; broad market surge.
Crypto ETF Technical Analysis:
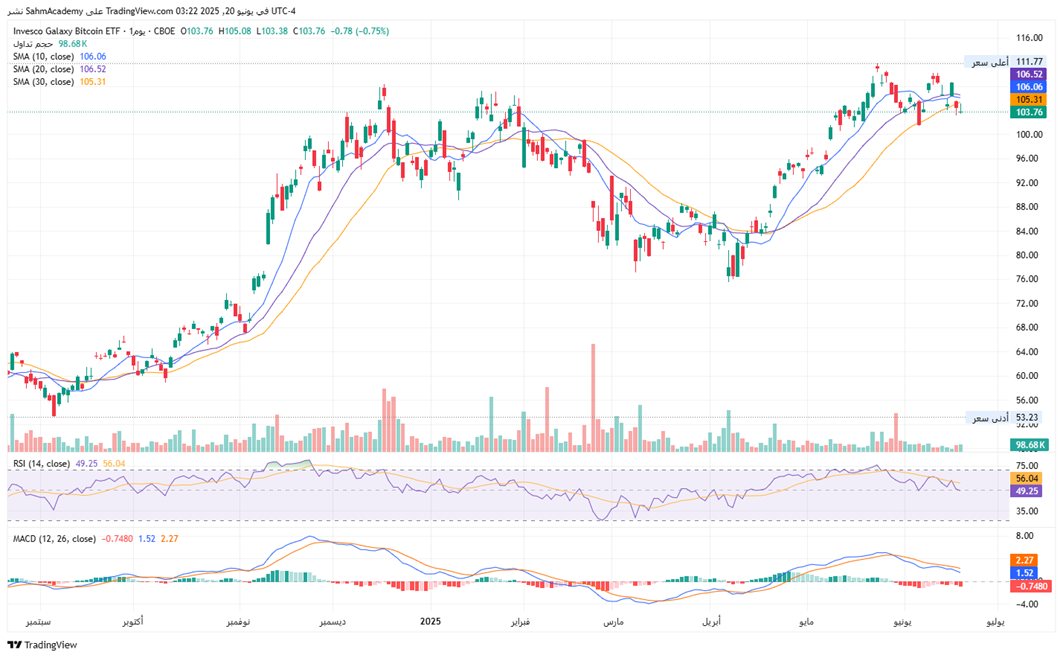
BTCO is consolidating near recent highs following a robust 95% advance from September 2024 lows, exhibiting a structurally intact bullish trend despite a short-term pullback below key SMAs ($106.06). Technical indicators suggest a neutral-to-constructive setup: RSI (49.25) has reset healthily from overbought territory, while MACD shows waning but non-aggressive bearish momentum. Critical support resides at the $100-$103 and the $98 consolidation floor, with resistance concentrated at the $106-$106.5 and the all-time high ($111.77). The base case anticipates continued consolidation between $100-$110 before a resumption of the uptrend, supported by institutional accumulation patterns and Bitcoin's favorable seasonality, though inherent crypto volatility and regulatory risks warrant vigilant monitoring of the $98 support breach level which would trigger a deeper correction scenario.
Disclaimer:
Sahm is subject to the supervision and control of the CMA, pursuant to its license no. 22251-25 issued by CMA.
The Information presented above is for information purposes only, which shall not be intended as and does not constitute an offer to sell or solicitation for an offer to buy any securities or financial instrument or any advice or recommendation with respect to such securities or other financial instruments or investments. When making a decision about your investments, you should seek the advice of a professional financial adviser and carefully consider whether such investments are suitable for you in light of your own experience, financial position and investment objectives. The firm and its analysts do not have any material interests or conflicts of interest in any companies mentioned in this report.
Performance data provided is accurate and sourced from reliable platforms, including Argaam, TradingView, MarketWatch.
IN NO EVENT SHALL SAHM CAPITAL FINANCIAL COMPANY BE LIABLE FOR ANY DAMAGES, LOSSES OR LIABILITIES INCLUDING WITHOUT LIMITATION, DIRECT OR INDIRECT, SPECIAL, INCIDENTAL, CONSEQUENTIAL DAMAGES, LOSSES OR LIABILITIES, IN CONNECTION WITH YOUR RELIANCE ON OR USE OR INABILITY TO USE THE INFORMATION PRESENTED ABOVE, EVEN IF YOU ADVISE US OF THE POSSIBILITY OF SUCH DAMAGES, LOSSES OR EXPENSES.
