We Value Your Feedback! Help us shape better content and experiences by participating in our survey. Join the Survey Now!
Saudi Market
TASI Technical Analysis:
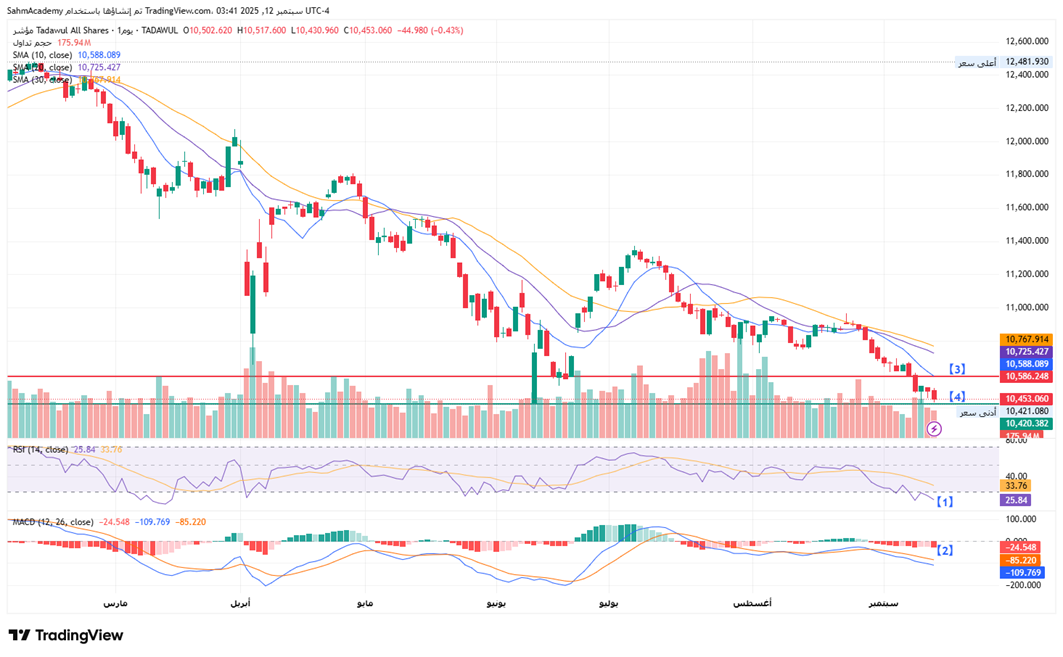
TASI index presents a deeply bearish technical structure. The index has established a clear pattern of lower highs and lower lows, with the current price at 10,453 representing a devastating decline of approximately 16.3% from the yearly high. The moving average configuration confirms the deteriorating trend, with all three key averages in bearish alignment: the 10-day SMA (10,588) trading below the 20-day SMA (10,725), which sits beneath the 30-day SMA (10,767). This creates a classic "death cross" formation that typically signals extended selling pressure. The recent breakdown below the critical 10,500 support level on elevated volume indicates institutional capitulation, while the failure to mount any meaningful recovery attempts suggests a lack of buying conviction across the Saudi equity market.
[1] The RSI at 25.84 has plunged deep into oversold territory below the 30 threshold, indicating extreme selling pressure but not yet showing the positive divergence patterns that typically precede significant reversals.
[2] The MACD histogram at -24.548 reflects severe bearish momentum acceleration, with the signal lines deeply entrenched in negative territory at -109.769, suggesting the selling pressure remains intense. The declining volume pattern during any bounce attempts confirms the absence of institutional accumulation.
[3] Key resistance levels have now formed at 10,586.
[4] Immediate support lies at the 10,420 and the potential panic low target near 10,200.
Given the technical carnage, any recovery attempt would likely face formidable resistance at previous support levels, and a break below 10,400 could trigger a capitulation move toward the 10,000 major psychological support, representing a potential 20% decline from the February highs.
TASI Index Weekly Market Summary (September 7 to September 11)
The TASI index decreased by 1.33%. With a trading week of 5 days, the total trading volume reached 17 billion Saudi Riyals, averaging 3.5 billion per day.
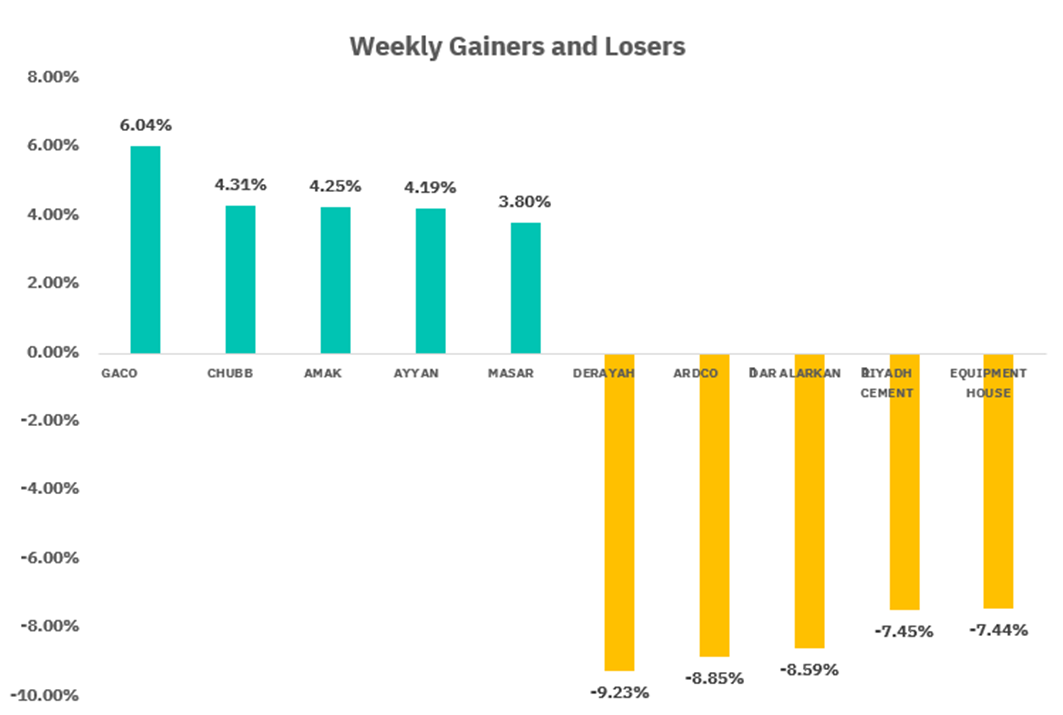
From the perspective of individual stock performance, 46 companies saw their stock prices rise this week, while 227 companies saw their stock prices fall. The companies with the highest increase included GACO, CHUBB, AMAK, with increases of 6.04%, 4.31%, and 4.25% respectively. The companies with the highest decline included DERAYAH, ARDCO, DAR ALARKAN with declines of 9.23%, 8.85%, and 8.59% respectively.
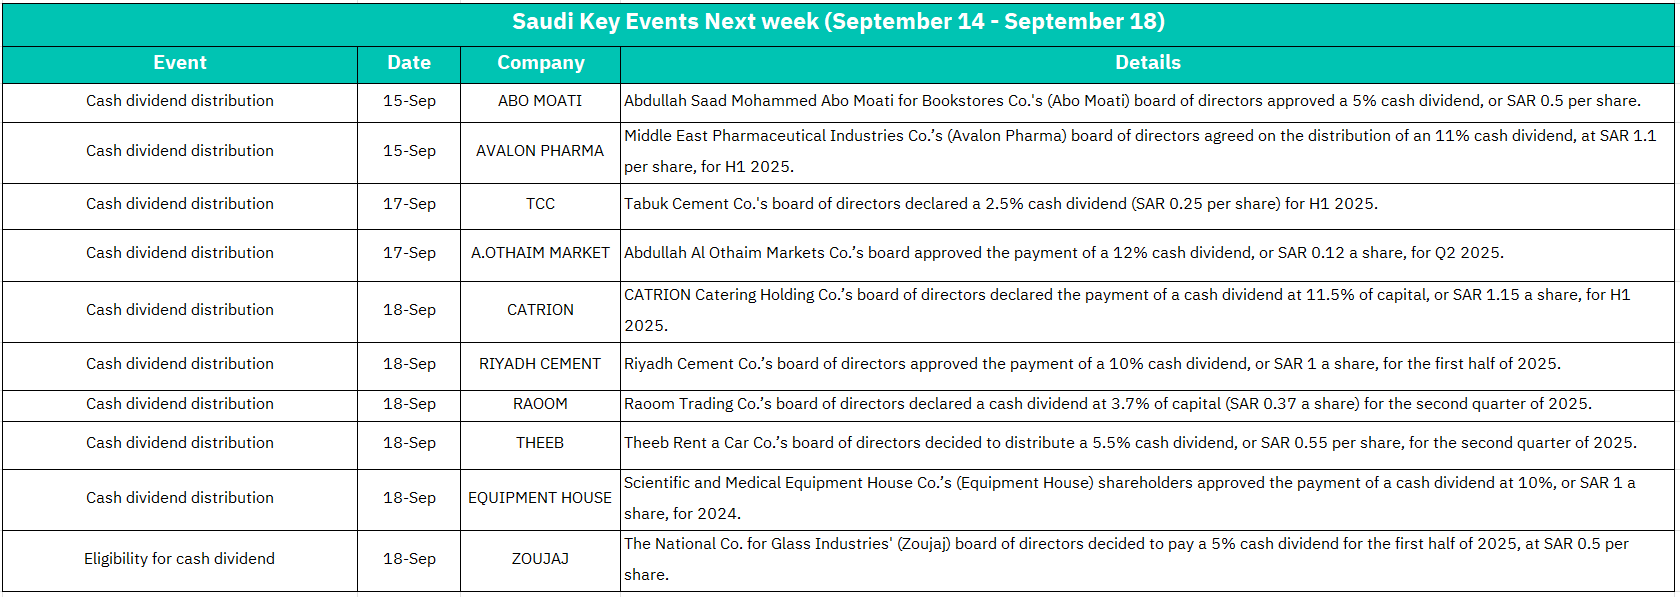
September 15:
ABO MOATI: 5% cash dividend distribution (SAR 0.5 per share)
AVALON PHARMA: 1.1% cash dividend distribution (SAR 1.1 per share for H1 2025)
Market Impact:
Positive sentiment expected for both companies as dividend distributions typically signal strong cash flows and management confidence. Healthcare and retail sectors may see increased investor interest, with AVALON PHARMA's higher dividend yield potentially attracting income-focused investors.
September 17:
TCC: 2.5% cash dividend distribution (SAR 0.25 per share for H1 2025)
A.OTHAIM MARKET: 12% cash dividend distribution (SAR 0.12 per share for Q2 2025)
Market Impact:
Strong positive impact anticipated, particularly for A.OTHAIM MARKET with its substantial 12% dividend yield indicating robust quarterly performance. The cement sector (TCC) may benefit from construction sector optimism, while retail sector (A.OTHAIM) could see increased institutional interest due to high dividend returns.
September 18:
CATRION: 11.5% cash dividend distribution (SAR 1.15 per share for H1 2025)
RIYADH CEMENT: 10% cash dividend distribution (SAR 1 per share for H1 2025)
RAOOM: 3.7% cash dividend distribution (SAR 0.37 per share for Q2 2025)
THEEB: 5.5% cash dividend distribution (SAR 0.55 per share for Q2 2025)
EQUIPMENT HOUSE: 10% cash dividend distribution (SAR 1 per share for 2024)
ZOUJAJ: Becomes eligible for 5% cash dividend (SAR 0.5 per share for H1 2025)
Market Impact:
Wednesday represents the most significant day with multiple high-yield dividend announcements. CATRION's 11.5% dividend and THEEB's substantial SAR 0.55 per share distribution are particularly noteworthy. This concentration of dividend payments may drive strong buying interest across multiple sectors including catering, cement, trading, automotive services, medical equipment, and manufacturing. The market may experience increased liquidity and positive momentum, especially benefiting dividend-focused investment strategies.
U.S. Market
S&P500 Technical Analysis:
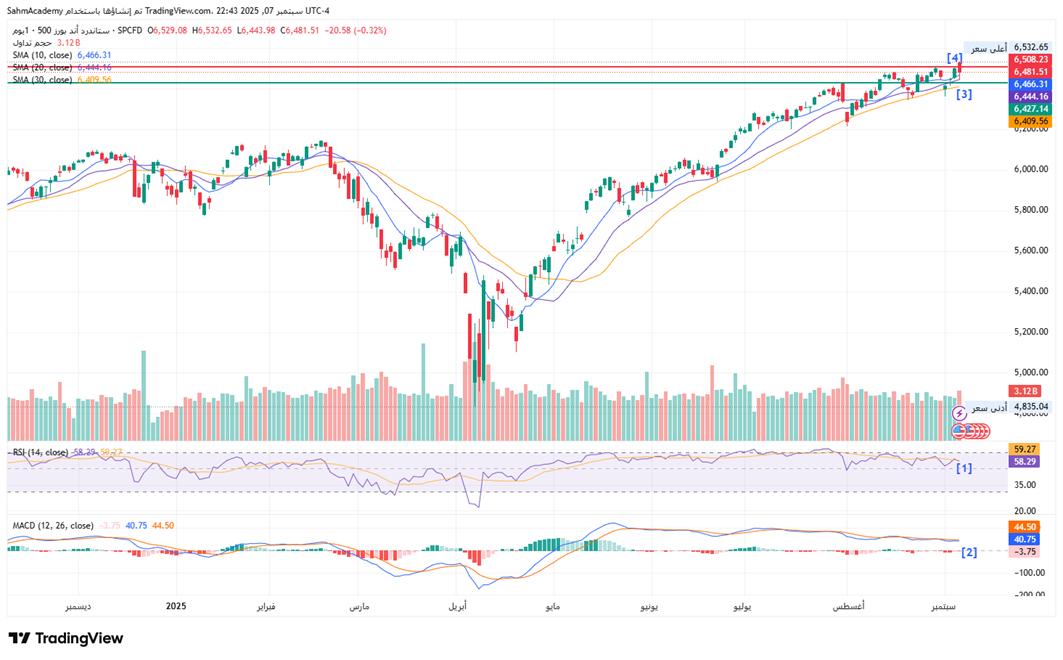
The S&P 500 Index demonstrates a bullish structure, having orchestrated a remarkable recovery from the April lows around 5,000 to achieve new all-time highs near 6,593. [1] The index has established a textbook ascending channel pattern that has been respected throughout the rally, with the current price at 6,587 positioned near the upper boundary of this trend channel. The moving average configuration presents a pristine bullish alignment, with the 10-day SMA (6,494) well above the 20-day SMA (6,467), which sits comfortably above the 30-day SMA (6,430), creating the ideal "staircase" pattern that institutional traders favor for sustained uptrends. Recent price action shows the SPX making incremental new highs on decent volume, though the pace of gains has moderated as the index approaches potential resistance near the 6,600 psychological level.
[2] The momentum indicators provide a constructive but cautious outlook for continued upside potential. The RSI at 67.77 has entered the upper portion of its range, approaching but not yet reaching overbought territory above 70, suggesting room for further gains albeit at a potentially slower pace.
[3] The MACD at 4.56 remains in positive territory with the histogram showing modest expansion, indicating that momentum remains intact though not accelerating dramatically. The sustained nature of this rally, spanning nearly five months, suggests strong institutional participation and broad-based market confidence.
[4] Key support levels are well-established at 6,431.
The technical picture suggests the SPX remains in a healthy primary uptrend with potential targets extending toward 6,700-6,750, though some consolidation or minor pullback toward the 6,500-6,520 support zone would be constructive before the next meaningful advance.
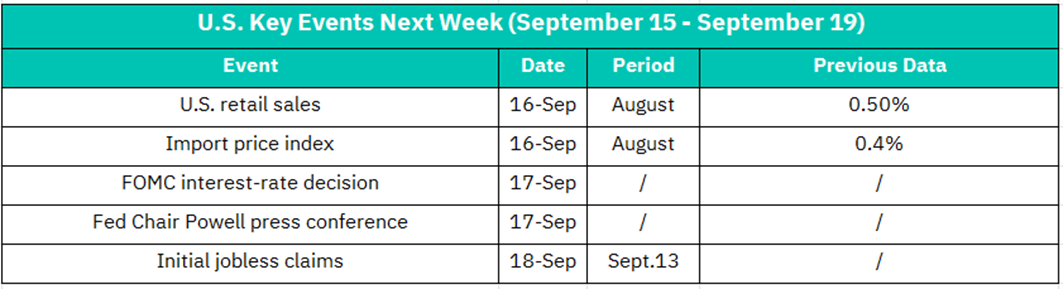
September 16:
U.S. Retail Sales (August data): Previous reading 0.50%
Import Price Index (August data): Previous reading 0.4%
Market Impact:
Retail sales data will be closely watched as a key indicator of consumer spending strength and economic resilience. A reading above 0.50% could boost consumer discretionary stocks and support market optimism about economic growth. The import price index will provide insights into inflationary pressures from overseas, potentially influencing Fed policy expectations. Strong retail sales combined with moderate import price increases would be viewed positively by markets, particularly benefiting retail, consumer goods, and growth-oriented sectors.
September 17:
FOMC Interest Rate Decision: The Federal Reserve's monetary policy announcement
Fed Chair Powell Press Conference: Post-FOMC meeting press conference
Market Impact:
This represents the week's most critical market-moving event. Markets will focus intensely on the Fed's interest rate decision and forward guidance. Any dovish signals or rate cuts could trigger significant rallies across equities, particularly in interest-sensitive sectors like technology, real estate, and utilities. Powell's press conference will be scrutinized for clues about future monetary policy direction, inflation outlook, and economic assessment. Bond markets, the dollar, and equity futures are likely to experience heightened volatility. Growth stocks may outperform value stocks if the Fed signals a more accommodative stance.
September 18:
Initial Jobless Claims (Week ending September 13): Labor market indicator
Market Impact:
Following Tuesday's Fed decision, jobless claims will provide additional context on labor market health. Lower-than-expected claims would reinforce economic strength and support the Fed's policy decisions, while higher claims might raise concerns about economic softening. The reading will be particularly significant if it confirms or contradicts the narrative established by the Fed's Tuesday announcement. Employment-sensitive sectors and small-cap stocks may react notably to any surprises in the data.
Crypto ETF Technical Analysis:
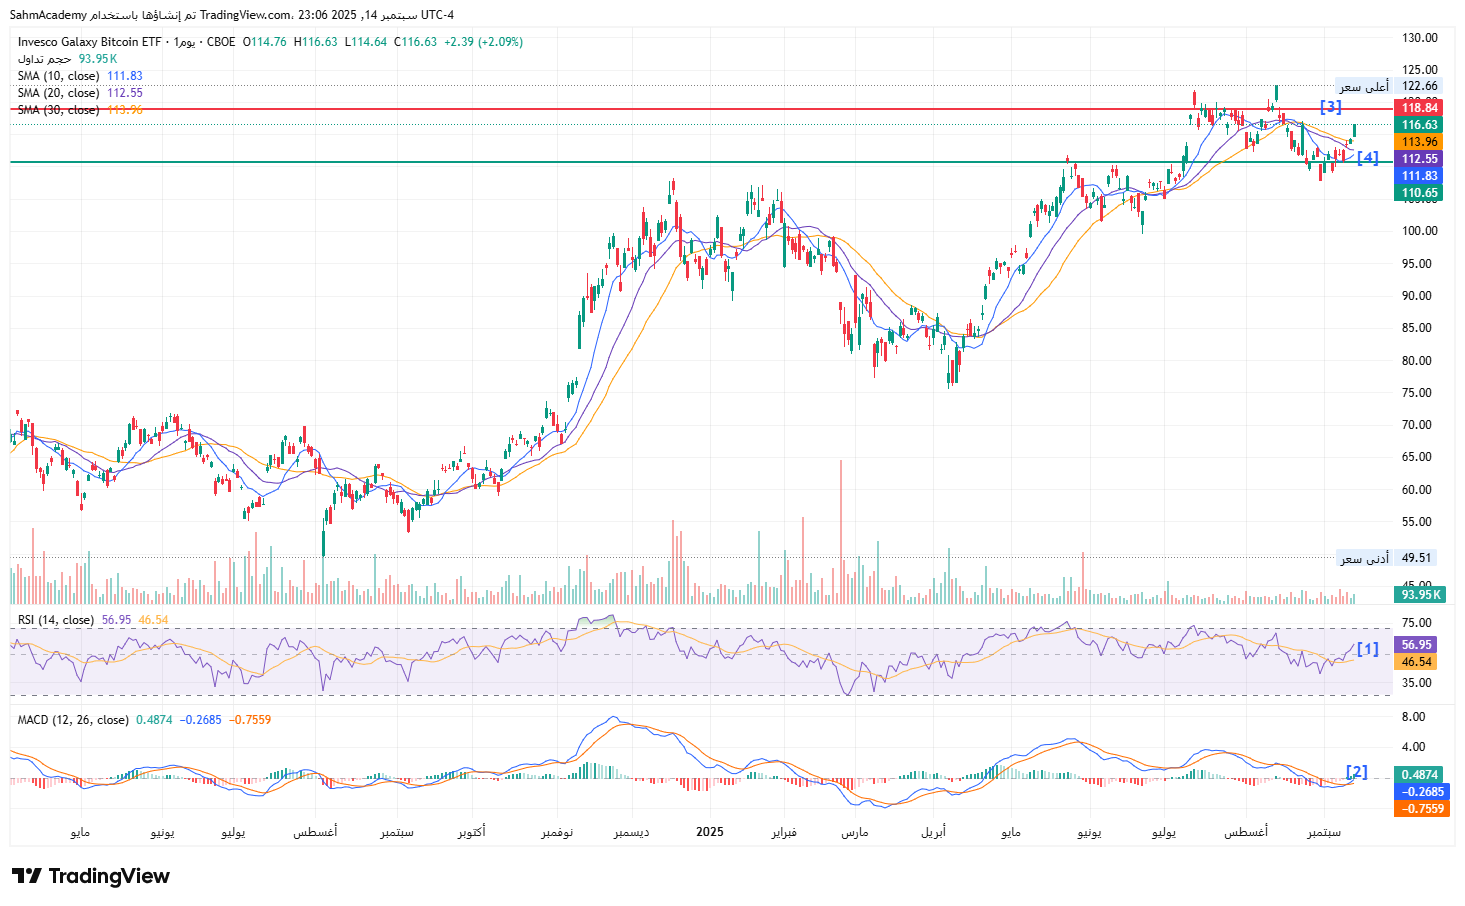
The Invesco Galaxy Bitcoin ETF (BTCO) recovery from the March lows around 82 to the July peaks near 122.66. Currently trading at 114.24, with the moving average structure showing signs of neutralization. The 10-day SMA (111.34) remains below the 20-day SMA (112.61), which sits beneath the 30-day SMA (113.95), creating a mildly bearish short-term configuration. The recent price action shows increased volatility with multiple failed attempts to reclaim the 118-120 resistance zone, while volume patterns suggest institutional indecision rather than committed buying or selling.
[1] The momentum indicators reflect the current state of technical uncertainty, with conflicting signals across different timeframes. The RSI at 52.66 , near the neutral 50 level, indicating a lack of directional momentum and suggesting the ETF is in a balancing phase between buyers and sellers.
[2] The MACD at 0.2130 remains marginally positive but shows signs of losing upward momentum, with the histogram flattening and the signal lines converging toward a potential bearish crossover. The elevated volume during recent trading sessions indicates active participation but lacks the conviction typically seen at major turning points.
[3] Key resistance levels are established at the 118 and the more significant 122 all-time high. [4] While support lies at 110.
A decisive break above 118 would likely target the previous highs and potentially extend toward 125-128, while a failure to hold 112 support could precipitate a deeper correction toward the 105-107 area, representing a normal retracement of the recent advance.
Disclaimer:
Sahm is subject to the supervision and control of the CMA, pursuant to its license no. 22251-25 issued by CMA.
The Information presented above is for information purposes only, which shall not be intended as and does not constitute an offer to sell or solicitation for an offer to buy any securities or financial instrument or any advice or recommendation with respect to such securities or other financial instruments or investments. When making a decision about your investments, you should seek the advice of a professional financial adviser and carefully consider whether such investments are suitable for you in light of your own experience, financial position and investment objectives. The firm and its analysts do not have any material interests or conflicts of interest in any companies mentioned in this report.
Performance data provided is accurate and sourced from reliable platforms, including Argaam, TradingView, MarketWatch.
IN NO EVENT SHALL SAHM CAPITAL FINANCIAL COMPANY BE LIABLE FOR ANY DAMAGES, LOSSES OR LIABILITIES INCLUDING WITHOUT LIMITATION, DIRECT OR INDIRECT, SPECIAL, INCIDENTAL, CONSEQUENTIAL DAMAGES, LOSSES OR LIABILITIES, IN CONNECTION WITH YOUR RELIANCE ON OR USE OR INABILITY TO USE THE INFORMATION PRESENTED ABOVE, EVEN IF YOU ADVISE US OF THE POSSIBILITY OF SUCH DAMAGES, LOSSES OR EXPENSES.