We Value Your Feedback! Help us shape better content and experiences by participating in our survey. Join the Survey Now!
Saudi Market
TASI Technical Analysis:
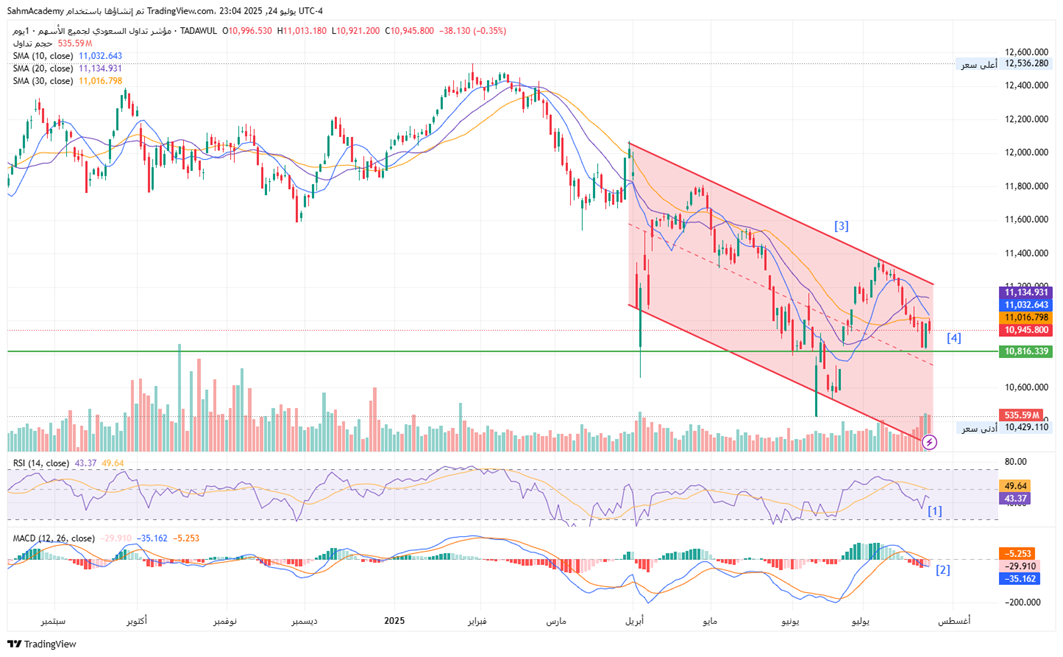
The TASI index is currently trapped in a well-defined bearish trend, declining approximately 13% from its peak of 12,536 to the current level of 10,945. The index is trading below all major moving averages (SMA 10: 11,032, SMA 20: 11,134, SMA 30: 11,016) in bearish alignment.
[1] Technical indicators confirm the negative momentum with RSI at 43.37.
[2] MACD showing negative momentum with an expanding bearish histogram at 35.16.
[3] The price action has formed a clear descending channel.
[4] The index is currently From a trading perspective, with immediate support at 10,816 if the current consolidation breaks lower.
Given the established downtrend and current positioning below key technical levels, maintaining a cautious stance with slight bearish bias is recommended until clear evidence of trend reversal emerges.
TASI Index Weekly Market Summary (July 20 to July 24)
The TASI index decreased by 0.17%. With a trading week of 5 days, the total trading volume reached 22 billion Saudi Riyals, averaging 4.5 billion per day.
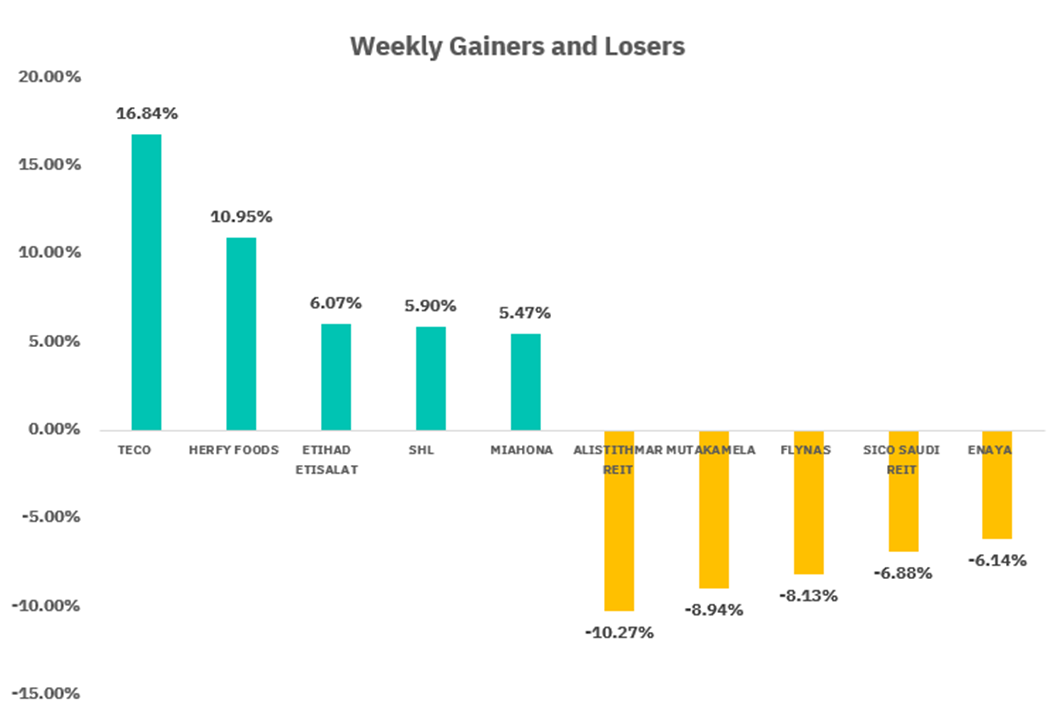
From the perspective of individual stock performance, 87 companies saw their stock prices rise this week, while 177 companies saw their stock prices fall. The companies with the highest increase included TECO, HERFY FOODS, ETIHAD ETISALAT, with increases of 16.84%, 10.95%, and 6.07% respectively. The companies with the highest decline included ALISTITHMAR REIT, MUTAKAMELA, FLYNAS with declines of 10.27%, 8.94%, and 8.13% respectively.
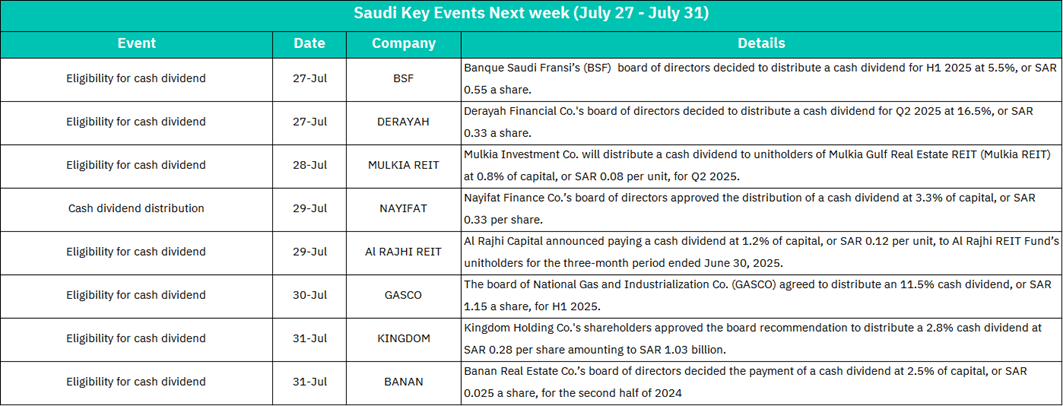
July 27:
BSF (Banque Saudi Fransi)
Eligibility for 5.5% cash dividend (SAR 0.55/share) for H1 2025.
Moderate payout may attract conservative investors, supporting short-term price stability but unlikely to drive significant momentum.
DERAYAH (Derayah Financial Co.)
Eligibility for 16.5% cash dividend (SAR 0.33/share) for Q2 2025.
Exceptionally high dividend yield could trigger strong buying interest pre-ex-date, potentially boosting stock liquidity and price.
July 28:
MULKIA REIT (Mulkia Gulf Real Estate REIT)
Eligibility for 0.8% cash dividend (SAR 0.08/unit) for Q2 2025.
Minimal yield below sector averages may disappoint income investors, risking mild sell pressure or sideways trading.
July 29:
NAYIFAT (Nayifat Finance Co.)
Distribution of 3.3% cash dividend (SAR 0.33/share).
Low payout could dampen enthusiasm; stock may underperform peers unless paired with positive operational updates.
Al RAJHI REIT (Al Rajhi REIT Fund)
Eligibility for 1.2% cash dividend (SAR 0.12/unit) for Q2 2025.
Subdued yield may reduce near-term appeal in REIT sector, though Al Rajhi’s brand reputation could mitigate downside.
July 30:
GASCO (National Gas and Industrialization Co.)
Eligibility for 11.5% cash dividend (SAR 1.15/share) for H1 2025.
Robust dividend signals financial health; likely to attract yield-focused funds, supporting upward price trajectory.
July 30:
KINGDOM (Kingdom Holding Co.)
Eligibility for 2.8% cash dividend (SAR 0.28/share, total SAR 1.03B).
Symbolic payout (low yield) may underwhelm given company scale; stock reaction hinges more on broader portfolio performance.
BANAN (Banan Real Estate Co.)
Eligibility for 2.5% cash dividend (SAR 0.025/share) for H2 2024.
Negligible yield and micro-sized payout could erode retail investor interest, pressuring liquidity.
U.S. Market
S&P500 Technical Analysis:
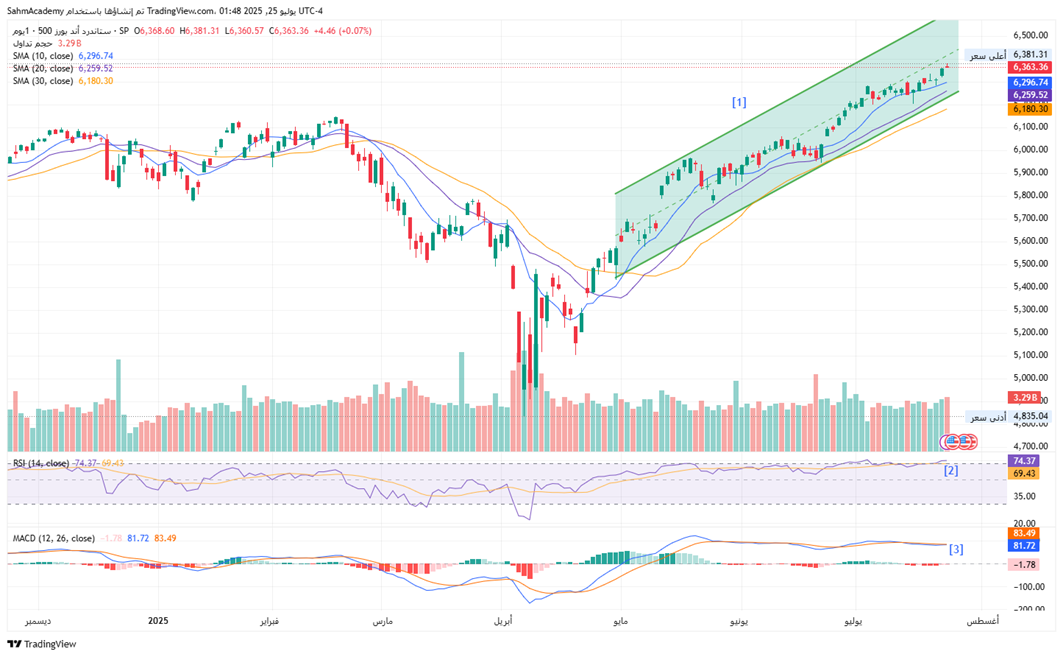
The S&P 500 Index continues to demonstrate exceptional bullish momentum, trading at fresh all-time highs near 6,381.31. Currently trading above all major moving averages in perfect bullish alignment: SMA 10 (6,296.74), SMA 20 (6,259.52), and SMA 30 (6,180.30), the index shows institutional accumulation patterns with consistent buying on any meaningful dips.
[1] The index exhibits a textbook uptrend structure with price action respecting a well-defined ascending channel that has been in place since May.
[2] Technical indicators remain constructively bullish with RSI at 74.37 in overbought territory but not at extreme levels.
[3] MACD at 81.72 continues to show strong positive momentum, confirming the sustainability of the current uptrend.
The technical setup presents an 80% probability of continued bullish momentum toward the next psychological resistance at 6,500-6,600, supported by the ascending channel's upper boundary and momentum characteristics typical of a mature but sustainable bull market.
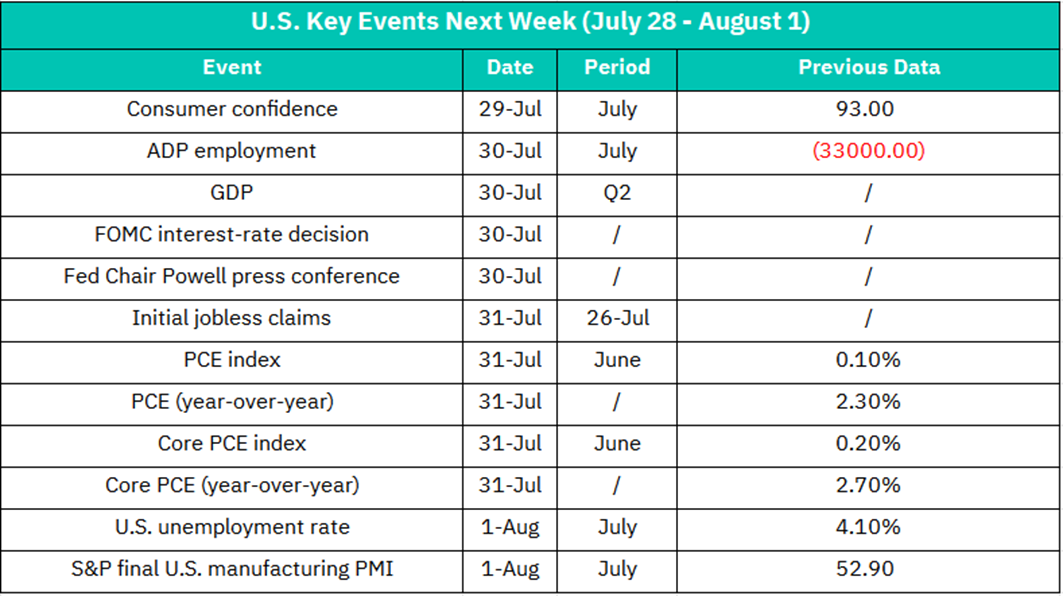
July 29:
Consumer Confidence (July)
Previous: 93.00
A reading above 95 would signal resilient consumer spending, boosting retail (e.g., Amazon, Walmart) and travel stocks. A drop below 90 could amplify recession fears, pressuring discretionary sectors.
July 30
ADP Employment (July)
Previous: -33,000
A positive rebound would ease labor market concerns, lifting financials (JPMorgan, Goldman Sachs) and industrials. Another negative print might trigger broad sell-offs.
GDP (Q2 Advance Estimate)
Growth >2.5% could reinforce "soft landing" hopes, fueling S&P 500 gains. Sub-1.5% might revive stagflation fears, hitting cyclicals hardest.
FOMC Rate Decision + Powell Press Conference
Dovish Hold (No Cut + Hints of 2024 Easing): Tech (NASDAQ) and real estate (XLRE) would rally.
Hawkish Hold (No Cut + Inflation Focus): Rate-sensitive sectors (utilities, REITs) may tumble.
Surprise Cut: Banks (KRE ETF) could sell off on margin concerns.
July 31
Initial Jobless Claims (July 26)
Claims >250k would spark labor market worries, dragging consumer stocks (Nike, Home Depot). Sub-220k may delay rate-cut bets, pressuring bonds.
PCE Inflation (June MoM/YoY & Core)
Previous: Core MoM 0.20%, YoY 2.70%
Core YoY ≤2.6%: Rate-cut euphoria; tech and small-caps (IWM) surge.
Core YoY ≥2.8%: Hawkish repricing; defensive sectors (XLP) outperform.
August 1
Unemployment Rate (July)
Previous: 4.10%
Rise to 4.3%+ could trigger recession alarms, sinking industrials (CAT) and transports. Hold at 4.1% may extend equity gains.
S&P Final Manufacturing PMI (July)
Previous: 52.90
Revisions >53.5 would signal industrial resilience, lifting materials (XLB). Sub-52.0 risks sector-wide profit-taking.
Crypto ETF Technical Analysis:
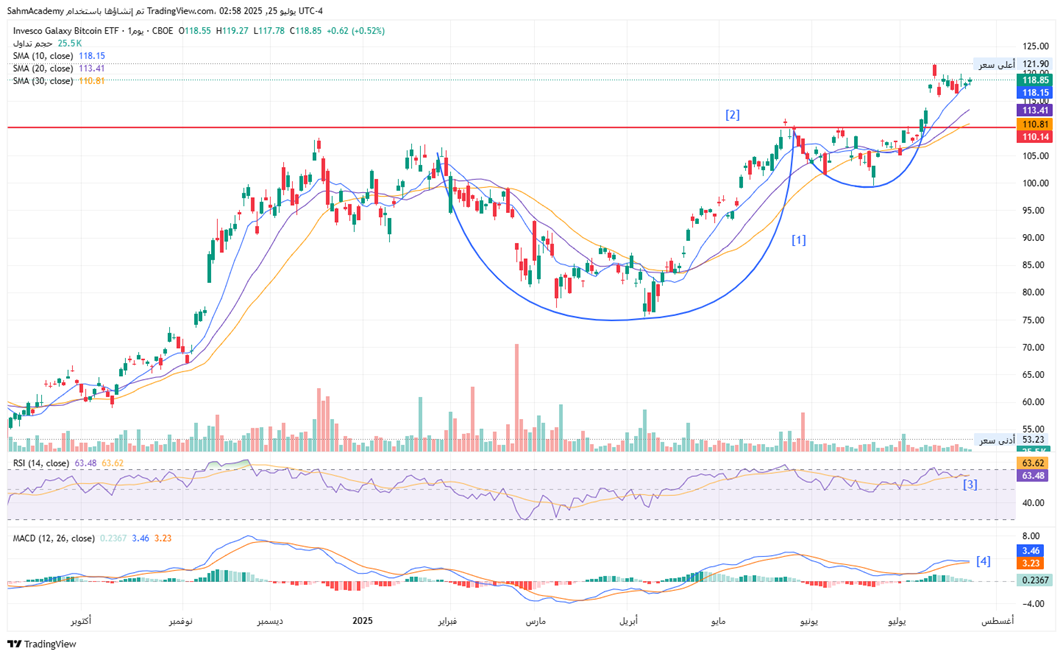
The Invesco Galaxy Bitcoin ETF has achieved a spectacular breakout to fresh all-time highs at $121.90. The ETF is currently trading above all major moving averages in perfect bullish alignment: SMA 10 ($118.15), SMA 20 ($113.41), and SMA 30 ($110.81), demonstrating exceptional institutional momentum in the cryptocurrency space.
[1] Confirming the completion of a major cup-and-handle pattern that formed from the March 2025 low around $75.52.
[2] The recent price action exhibits characteristics of a parabolic advance with strong volume confirmation, particularly evident in the breakout phase above the previous resistance at $110.
[3] Technical indicators reflect robust bullish momentum with RSI at 63.48 showing healthy strength without reaching extreme overbought conditions.
[4] MACD at 3.46 continues to display positive momentum with expanding histogram, confirming the sustainability of the current uptrend.
The volume profile during the recent rally shows significant institutional accumulation, with the 25.5K volume reading indicating strong conviction behind the breakout move.
Disclaimer:
Sahm is subject to the supervision and control of the CMA, pursuant to its license no. 22251-25 issued by CMA.
The Information presented above is for information purposes only, which shall not be intended as and does not constitute an offer to sell or solicitation for an offer to buy any securities or financial instrument or any advice or recommendation with respect to such securities or other financial instruments or investments. When making a decision about your investments, you should seek the advice of a professional financial adviser and carefully consider whether such investments are suitable for you in light of your own experience, financial position and investment objectives. The firm and its analysts do not have any material interests or conflicts of interest in any companies mentioned in this report.
Performance data provided is accurate and sourced from reliable platforms, including Argaam, TradingView, MarketWatch.
IN NO EVENT SHALL SAHM CAPITAL FINANCIAL COMPANY BE LIABLE FOR ANY DAMAGES, LOSSES OR LIABILITIES INCLUDING WITHOUT LIMITATION, DIRECT OR INDIRECT, SPECIAL, INCIDENTAL, CONSEQUENTIAL DAMAGES, LOSSES OR LIABILITIES, IN CONNECTION WITH YOUR RELIANCE ON OR USE OR INABILITY TO USE THE INFORMATION PRESENTED ABOVE, EVEN IF YOU ADVISE US OF THE POSSIBILITY OF SUCH DAMAGES, LOSSES OR EXPENSES.