We Value Your Feedback! Help us shape better content and experiences by participating in our survey. Join the Survey Now!
Saudi Market
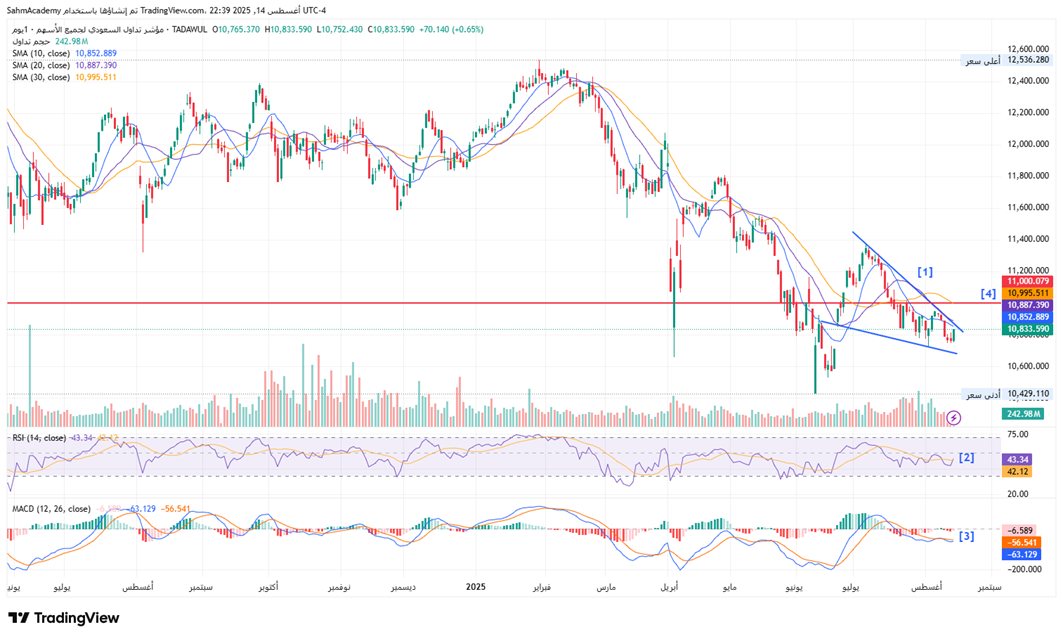
TASI Technical Analysis:
The TASI is showing signs of potential stabilization at 10,833.59 and forming what appears to be a descending wedge pattern [1]. The index is trading below all major moving averages (SMA 10: 10,852.89, SMA 20: 10,887.39, SMA 30: 10,995.51), confirming the bearish trend structure.
[2] The RSI at 43.34 is recovering from oversold conditions.
[3] The MACD histogram at -6.589 shows signs of convergence, suggesting bearish momentum may be waning. Volume patterns indicate controlled selling rather than panic distribution, supporting a potential bottoming thesis.
[4] The technical setup presents a critical inflection point with key resistance at 11,000.
TASI Index Weekly Market Summary (August 10 to August 14)
The TASI index decreased by 0.6%. With a trading week of 5 days, the total trading volume reached 20 billion Saudi Riyals, averaging 4.1 billion per day.
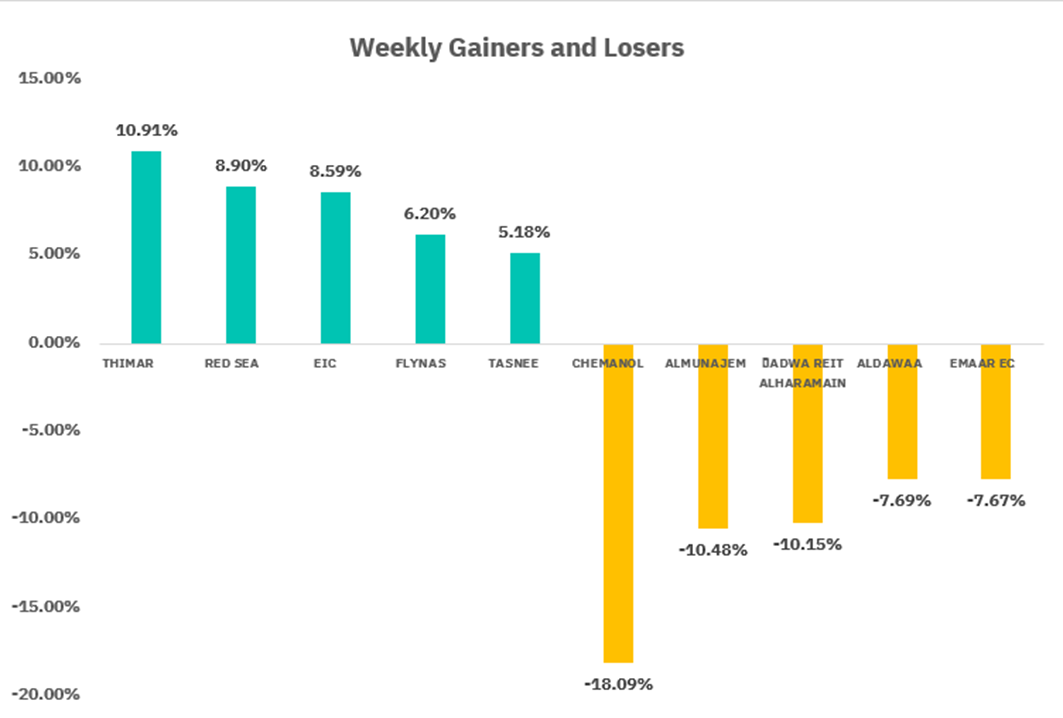
From the perspective of individual stock performance, 76 companies saw their stock prices rise this week, while 197 companies saw their stock prices fall. The companies with the highest increase included THIMAR, RED SEA, EIC, with increases of 10.91%, 8.90%, and 8.59% respectively. The companies with the highest decline included CHEMANOL, ALMUNAJEM, JADWA REIT ALHARAMAIN with declines of 18.09%, 10.84 %, and 10.15% respectively.
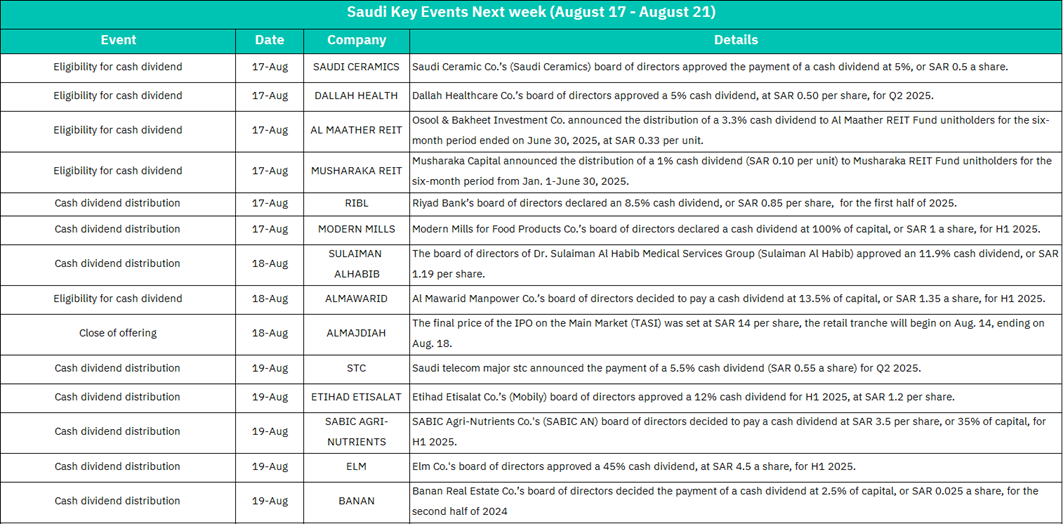
August 17 :
SAUDI CERAMICS - Cash dividend eligibility (5% yield, SAR 0.5/share)
DALLAH HEALTH - Cash dividend eligibility (5% dividend, SAR 0.50/share for Q2 2025)
AL MAATHER REIT - Cash dividend eligibility (3.3% dividend, SAR 0.33/unit)
MUSHARAKA REIT - Cash dividend eligibility (1% dividend, SAR 0.10/unit)
RIBL - Cash dividend distribution (8.5% dividend, SAR 0.85/share for H1 2025)
MODERN MILLS - Cash dividend distribution (100% of capital, SAR 1/share for H1 2025)
Market Impact: HIGH POSITIVE - Multiple high-yield distributions across diverse sectors. MODERN MILLS' exceptional 100% capital dividend and RIBL's 8.5% yield will drive significant investor interest.
August 18:
SULAIMAN ALHABIB - Cash dividend distribution (11.9% dividend, SAR 1.19/share)
ALMAWARID - Cash dividend eligibility (13.5% of capital, SAR 1.35/share for H1 2025)
ALMAJDIAH - IPO close of offering (Final price: SAR 14/share, retail tranche Aug 14-18)
Market Impact: VERY HIGH - Peak activity day with SULAIMAN AL HABIB's substantial healthcare dividend and ALMAWARID's impressive 13.5% yield. ALMAJDIAH IPO completion adds new real estate investment option.
August 19:
STC - Cash dividend distribution (5.5% dividend, SAR 0.55/share for Q2 2025)
ETIHAD ETISALAT - Cash dividend distribution (12% dividend, SAR 1.2/share for H1 2025)
SABIC AGRI-NUTRIENTS - Cash dividend distribution (35% of capital, SAR 3.5/share for H1 2025)
ELM - Cash dividend distribution (45% dividend, SAR 4.5/share for H1 2025)
BANAN - Cash dividend distribution (2.5% of capital, SAR 0.025/share for H2 2024)
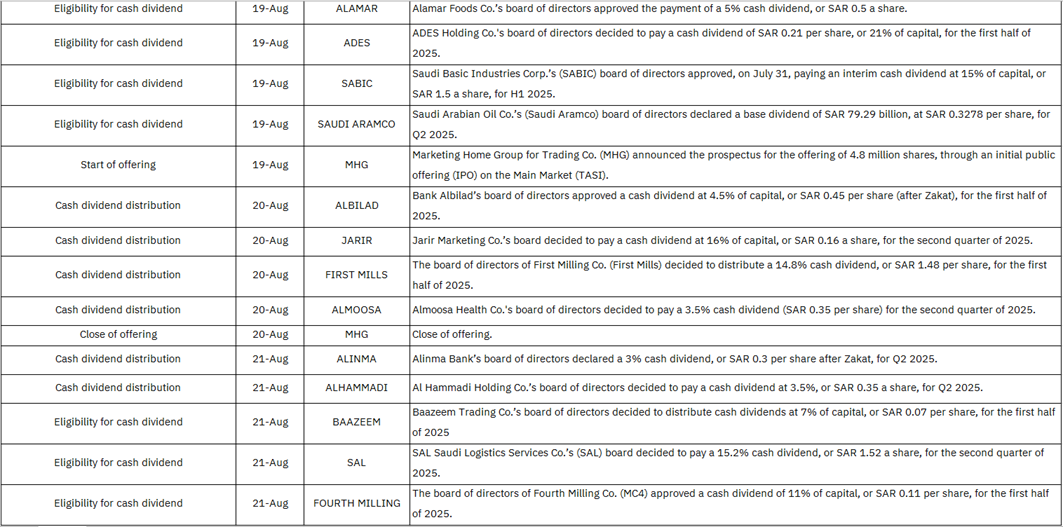
ALAMAR - Cash dividend eligibility (5% dividend, SAR 0.5/share)
ADES - Cash dividend eligibility (21% of capital, SAR 0.21/share for H1 2025)
SABIC - Cash dividend eligibility (15% of capital, SAR 1.5/share for H1 2025)
SAUDI ARAMCO - Cash dividend eligibility (Base dividend SAR 79.29 billion, SAR 0.3276/share for Q2 2025)
MHG - Start of IPO offering (4.8 million shares through IPO on TASI)
Market Impact: MAXIMUM SIGNIFICANCE - Busiest day with SAUDI ARAMCO's massive dividend and multiple high-yield distributions. ELM's 45% and SABIC AGRI-NUTRIENTS' 35% dividends will create substantial market liquidity.
August 20:
ALBILAD - Cash dividend distribution (4.5% of capital, SAR 0.45/share for H1 2025)
JARIR - Cash dividend distribution (16% of capital, SAR 0.16/share for Q2 2025)
FIRST MILLS - Cash dividend distribution (14.8% dividend, SAR 1.48/share for H1 2025)
ALMOOSA - Cash dividend distribution (3.5% dividend, SAR 0.35/share for Q2 2025)
MHG - Close of IPO offering
ALINMA - Cash dividend distribution (3% dividend, SAR 0.03/share for Q2 2025)
Market Impact: MODERATE TO HIGH - Continued dividend momentum across banking and industrial sectors. MHG IPO closure provides additional market activity.
August 21
ALHAMMADI - Cash dividend distribution (3.5% dividend, SAR 0.35/share for Q2 2025)
BAAZEEM - Cash dividend eligibility (7% of capital, SAR 0.07/share for H1 2025)
SAL - Cash dividend eligibility (15.2% dividend, SAR 1.52/share for Q2 2025)
FOURTH MILLING - Cash dividend eligibility (11% of capital, SAR 0.11/share for H1 2025)
Market Impact: MODERATE - Week concludes with steady dividend activity, particularly SAL's notable 15.2% yield maintaining positive momentum.
U.S. Market
S&P500 Technical Analysis:
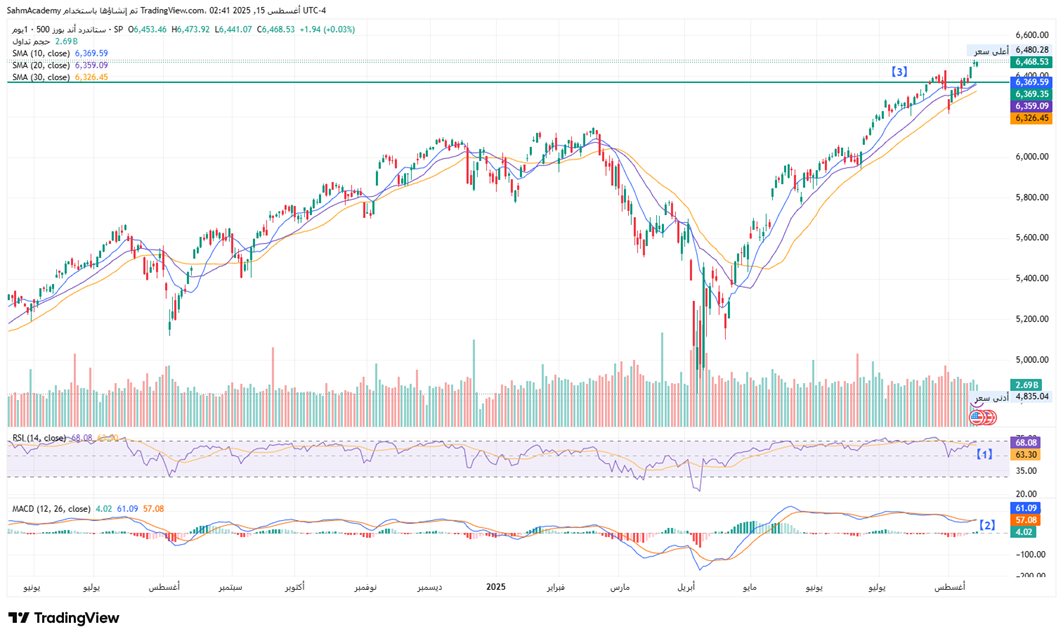
The index is currently displaying strong bullish momentum with the price trading at 6,468.53. The price action shows the index trading well above all major moving averages (10, 20, and 30-period SMAs at 6,369.59, 6,359.09, and 6,326.45 respectively), indicating strong underlying momentum.
[1] The RSI at 68.08 suggests the market is approaching overbought territory but hasn't reached extreme levels.
[2] The MACD remains in positive territory with the histogram showing continued bullish divergence.
[3] The key support zone now sits around 6,370, coinciding with the 10-period SMA and previous resistance-turned-support.
Volume patterns show healthy participation during rallies, though recent sessions indicate some distribution as institutional players may be taking profits at these elevated levels.
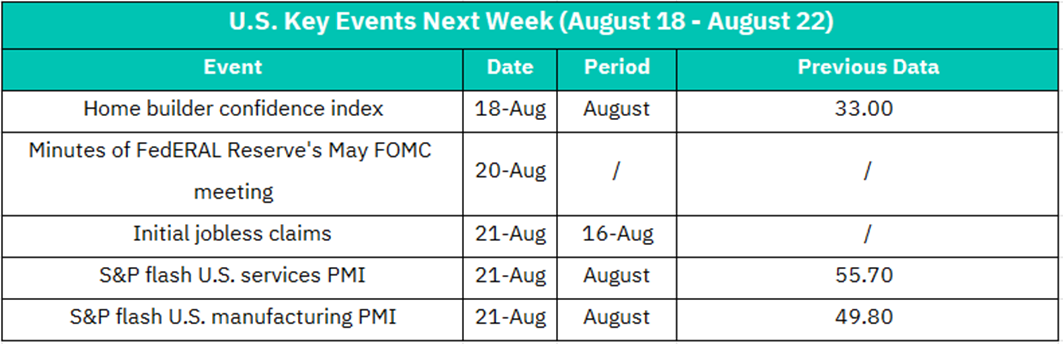
August 18:
Home Builder Confidence Index - August data
Previous: 33.00
Market Impact: MODERATE SIGNIFICANCE
• Housing sector indicator reflecting builder sentiment and future construction activity
• Previous reading of 33.00 indicates severely depressed confidence (readings below 50 suggest negative sentiment)
• Real estate and construction stocks directly sensitive to this data
• Interest rate sensitivity: Housing confidence heavily influenced by mortgage rate environment
• Sectors affected: Home builders (D.R. Horton, Lennar, Pulte), building materials (Home Depot, Lowe's)
August 20:
Minutes of Federal Reserve's May FOMC Meeting
Market Impact: HIGH SIGNIFICANCE
Critical Fed policy insights revealing internal discussions and future rate path considerations
Market-moving potential through hawkish or dovish commentary details
Key focus areas:
• Inflation progress assessment
• Employment market evaluation
• Rate cut timeline and conditions
• Quantitative tightening (QT) policy discussions
Broad market impact across all sectors, particularly interest-sensitive areas
Bond and currency markets will react first, followed by equity repositioning
August 21:
Initial Jobless Claims - Week ending August 16
• Previous: N/A (Weekly data)
S&P Flash U.S. Services PMI - August preliminary
• Previous: 55.70
S&P Flash U.S. Manufacturing PMI - August preliminary
• Previous: 49.80
Market Impact: VERY HIGH SIGNIFICANCE
• Triple data release providing comprehensive economic health snapshot
• Labor market strength via jobless claims critical for Fed policy
• PMI data offers real-time business activity assessment
Services PMI Analysis:
• Previous 55.70 indicates strong expansion (above 50)
• Services represent ~80% of U.S. economy
• Technology, healthcare, financial services stocks sensitive to services strength
Manufacturing PMI Analysis:
• Previous 49.80 suggests slight contraction (below 50)
• Industrial, materials, machinery stocks directly impacted
• Export-dependent companies sensitive to manufacturing trends
Crypto ETF Technical Analysis:
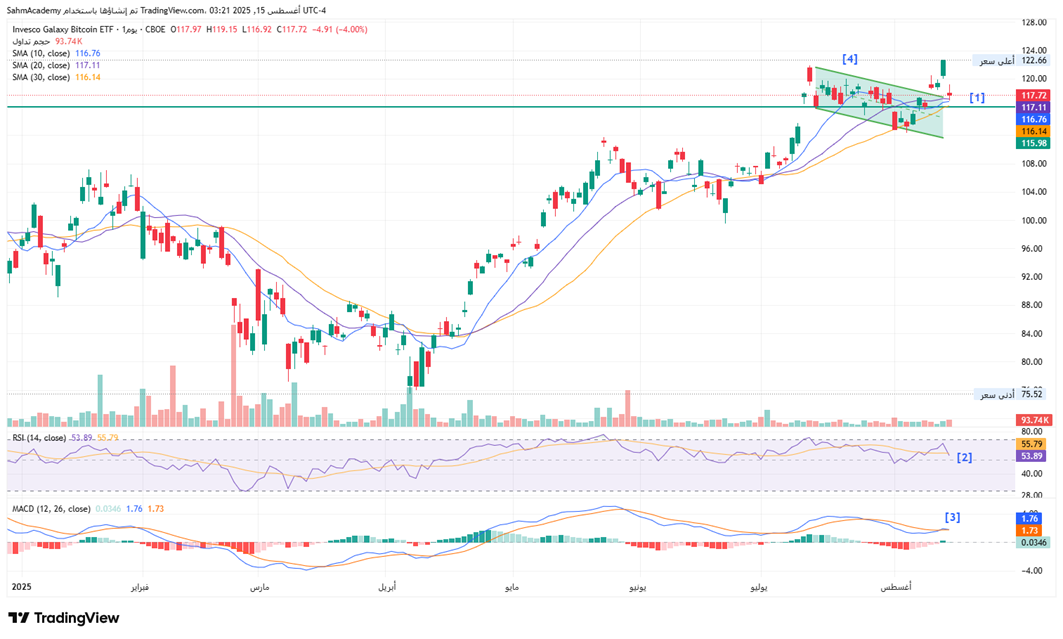
The Invesco Galaxy Bitcoin ETF (BTCO) is currently trading at $117.72, displaying a corrective pullback from its recent highs near $122.66. The moving average configuration remains bullish with the 10-day SMA at $116.76 providing immediate support, while the 20-day ($117.11) and 30-day ($116.14) SMAs are converging in a tight range, suggesting potential volatility compression ahead of a directional breakout.
[1] The price now testing critical support around the $116.
[2] The RSI at 53.89 indicates neutral momentum with room for movement in either direction.
[3] The MACD histogram shows diminishing bearish momentum, suggesting the current selloff may be losing steam.
[4] The current price action appears to be forming a bull flag pattern, with volume patterns showing healthy accumulation during dips and distribution during rallies - typical behavior for institutional crypto exposure vehicles.
Disclaimer:
Sahm is subject to the supervision and control of the CMA, pursuant to its license no. 22251-25 issued by CMA.
The Information presented above is for information purposes only, which shall not be intended as and does not constitute an offer to sell or solicitation for an offer to buy any securities or financial instrument or any advice or recommendation with respect to such securities or other financial instruments or investments. When making a decision about your investments, you should seek the advice of a professional financial adviser and carefully consider whether such investments are suitable for you in light of your own experience, financial position and investment objectives. The firm and its analysts do not have any material interests or conflicts of interest in any companies mentioned in this report.
Performance data provided is accurate and sourced from reliable platforms, including Argaam, TradingView, MarketWatch.
IN NO EVENT SHALL SAHM CAPITAL FINANCIAL COMPANY BE LIABLE FOR ANY DAMAGES, LOSSES OR LIABILITIES INCLUDING WITHOUT LIMITATION, DIRECT OR INDIRECT, SPECIAL, INCIDENTAL, CONSEQUENTIAL DAMAGES, LOSSES OR LIABILITIES, IN CONNECTION WITH YOUR RELIANCE ON OR USE OR INABILITY TO USE THE INFORMATION PRESENTED ABOVE, EVEN IF YOU ADVISE US OF THE POSSIBILITY OF SUCH DAMAGES, LOSSES OR EXPENSES.